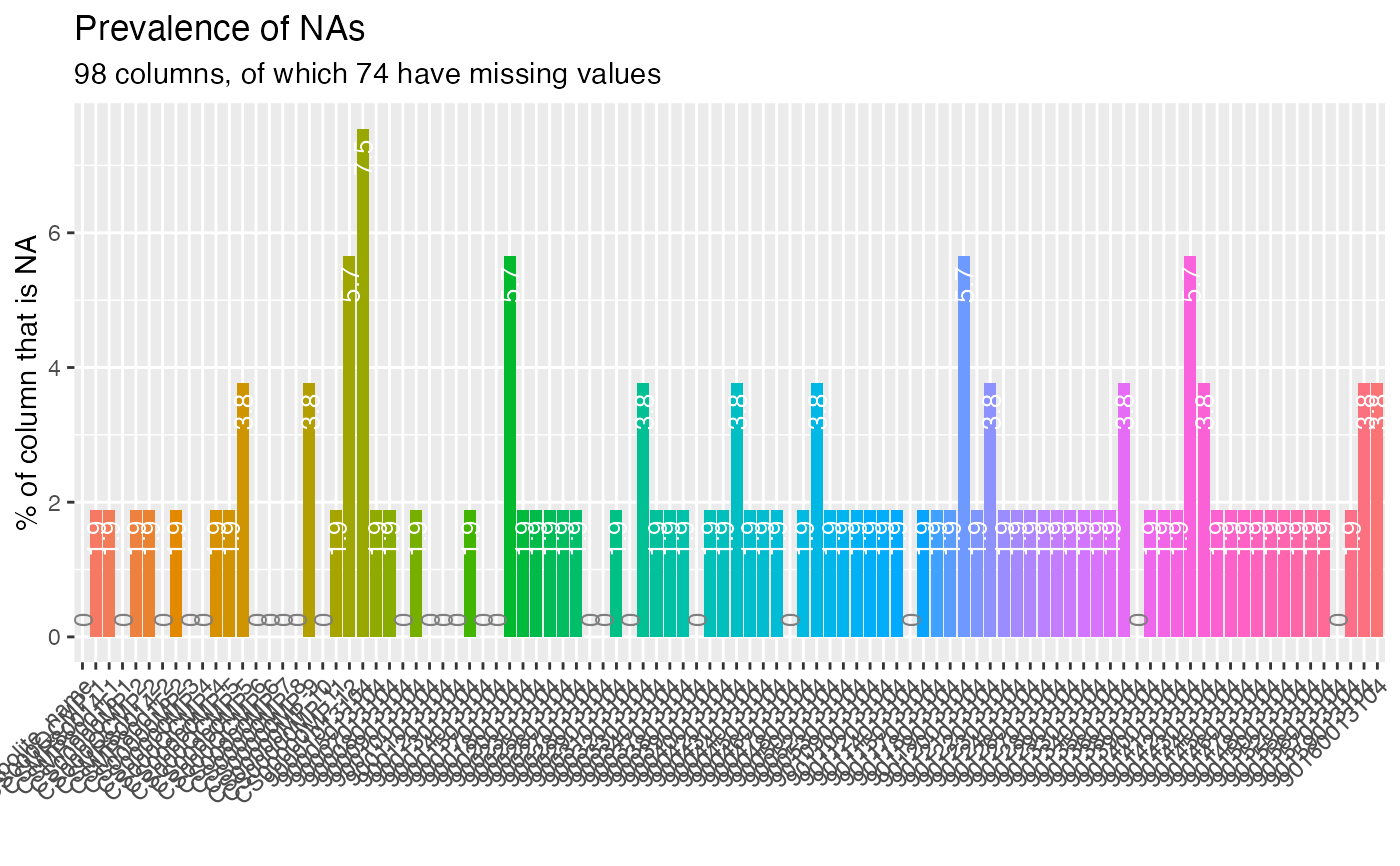
Bar plot with the percentage of NA values in every column of
a data frame. The bars follow the order of the columns in the data frame.
The percentages are calculated with naniar::miss_var_summary().
This function replaces the inspectdf::inspect_na() %>% inspectdf::show_plot()
chart previously used in the QC plots: inspectdf was archived from CRAN
(2026-04-10), which made the package impossible to install from a clean
library.