Plot timewise differential analysis results for a single feature. Points are log fold-changes, and error bars indicate standard errors.
Usage
plot_feature_logfc(
  assay = NULL,
  tissue = NULL,
  feature_ID = NULL,
  feature = NULL,
  title = NULL,
  add_gene_symbol = FALSE,
  facet_by_sex = FALSE,
  scale_x_by_time = TRUE,
  add_adj_p = TRUE,
  metareg = TRUE,
  return_data = FALSE,
  ...
)
Arguments
- assay
NULL or character, assay abbreviation, one of MotrpacRatTraining6moData::ASSAY_ABBREV
- tissue
NULL or character, tissue abbreviation, one of MotrpacRatTraining6moData::TISSUE_ABBREV
- feature_ID
NULL or character, MoTrPAC feature identifier or metabolite RefMet ID
- feature
NULL or character, unique feature identifier in the format 'MotrpacRatTraining6moData::ASSAY_ABBREV;MotrpacRatTraining6moData::TISSUE_ABBREV;feature_ID' only for training-regulated features at 5% IHW FDR. For redundant differential features, 'feature_ID' is prepended with the specific platform to make unique identifiers. See MotrpacRatTraining6moData::REPEATED_FEATURES for details.. If NULL,
assay,tissue, andfeature_IDmust all be specified.- title
character, plot title. By default, the plot ID is
feature. Ifadd_gene_symbol = TRUE, the gene symbol is also added to the plot title.- add_gene_symbol
bool, whether to add corresponding gene symbol to plot title. Default: FALSE
- facet_by_sex
bool, whether to facet the plot by sex. If
TRUE, lines are colored by tissue. IfFALSE, lines are colored by sex. Default: FALSE- scale_x_by_time
bool, whether to scale the x-axis by time. If
FALSE, space the time points (0w, 1w, 2w, 4w, 8w) evenly. Default: TRUE- add_adj_p
bool, whether to include the training adjusted p-value (AKA selection FDR) in the plot subtitle. Default: TRUE
- metareg
bool, whether to use the meta-regression version of differential analysis results for metabolomics data. If
FALSE, use the redundant, non-meta-analyzed results. Default: TRUE- return_data
bool, whether to return data instead of plot. Default: FALSE
- ...
additional arguments passed to
get_file_from_url()
Value
a ggplot2::ggplot() object or a data frame if return_data = TRUE
or NULL if the data cannot be found
Examples
# Plot a differential feature and add gene symbol
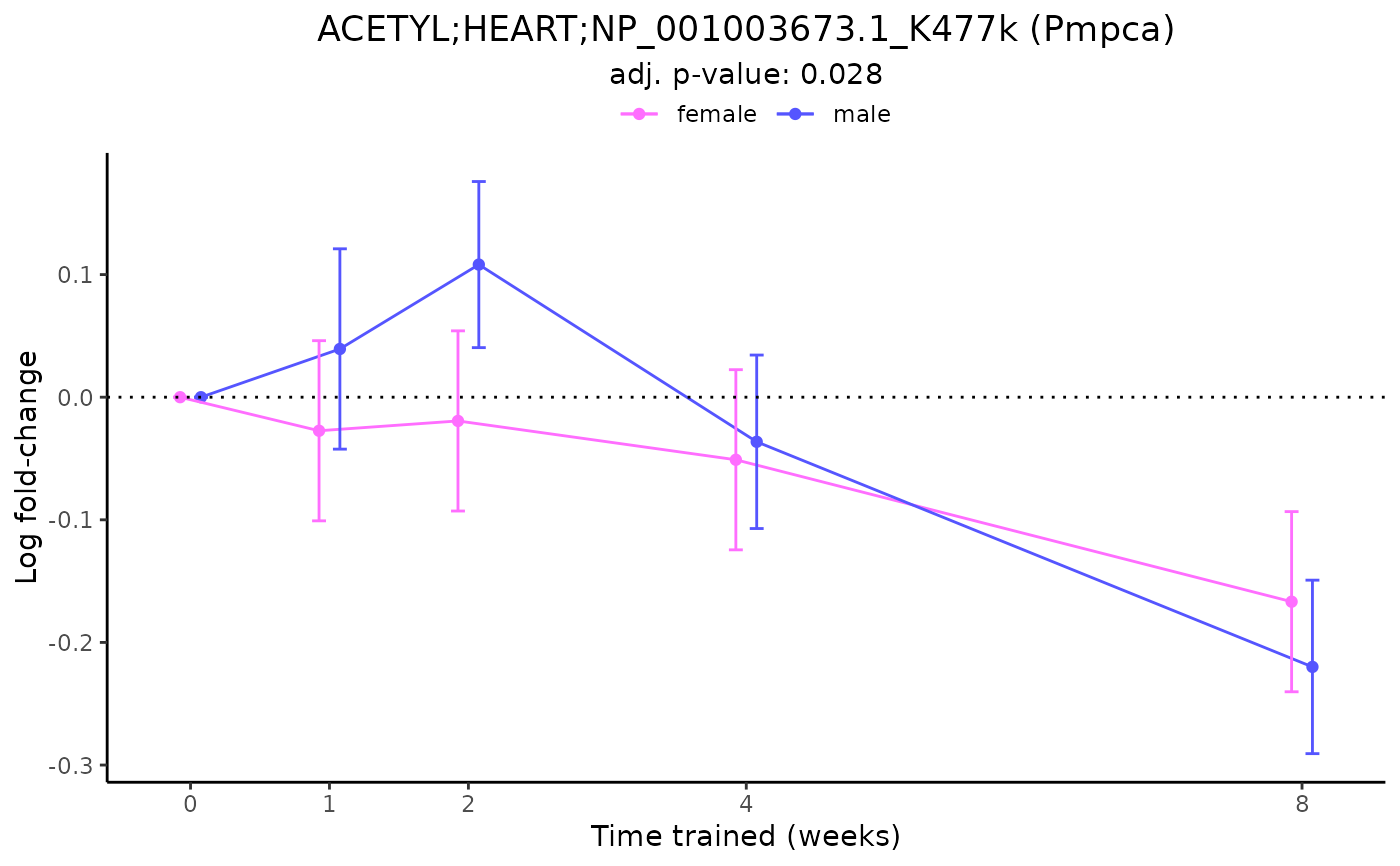
plot_feature_logfc(feature = "ACETYL;HEART;NP_001003673.1_K477k",
add_gene_symbol = TRUE)
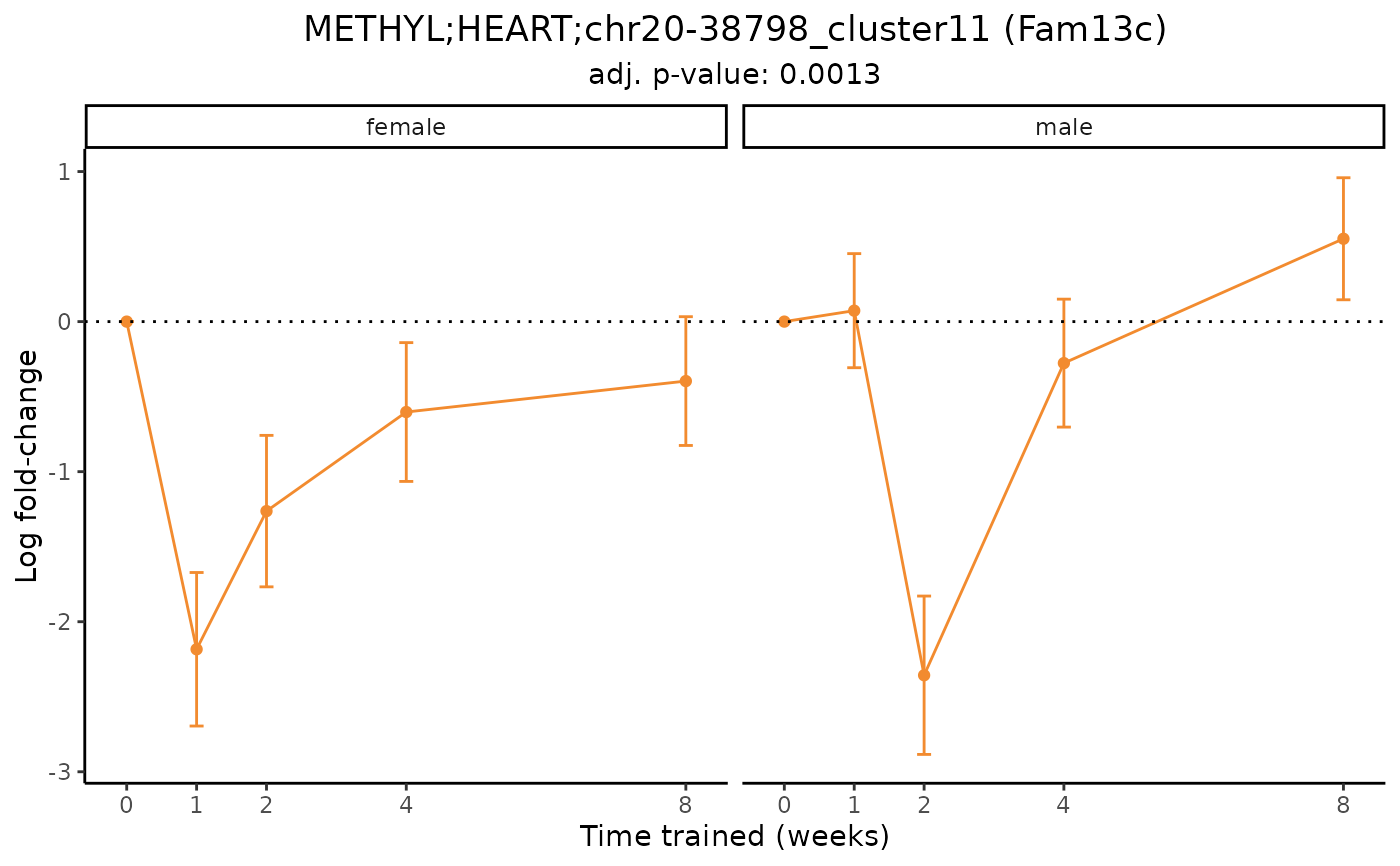
 # Plot a differential epigenetic feature and facet by sex
plot_feature_logfc(feature = "METHYL;HEART;chr20-38798_cluster11",
add_gene_symbol = TRUE,
facet_by_sex = TRUE)
# Plot a differential epigenetic feature and facet by sex
plot_feature_logfc(feature = "METHYL;HEART;chr20-38798_cluster11",
add_gene_symbol = TRUE,
facet_by_sex = TRUE)
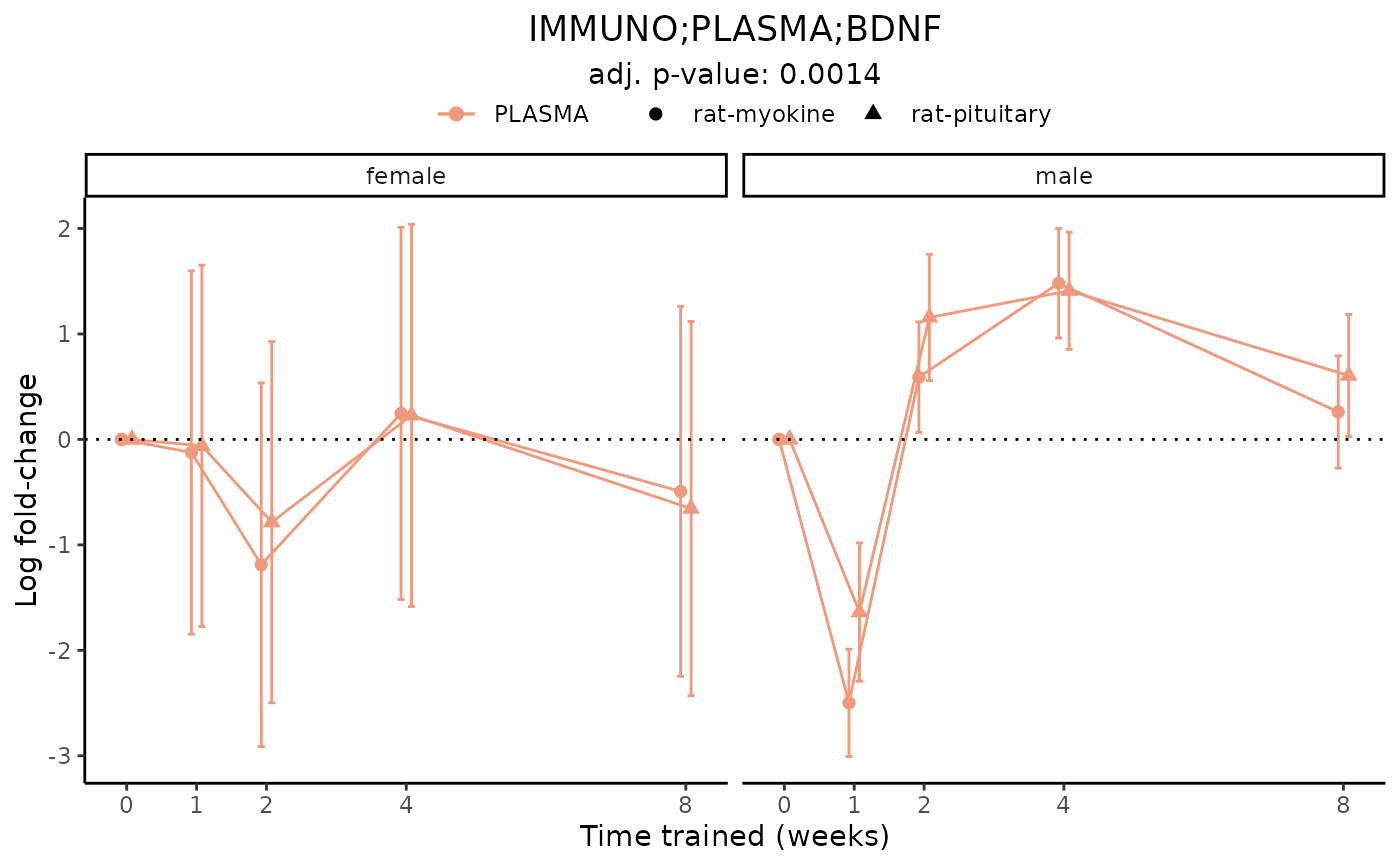
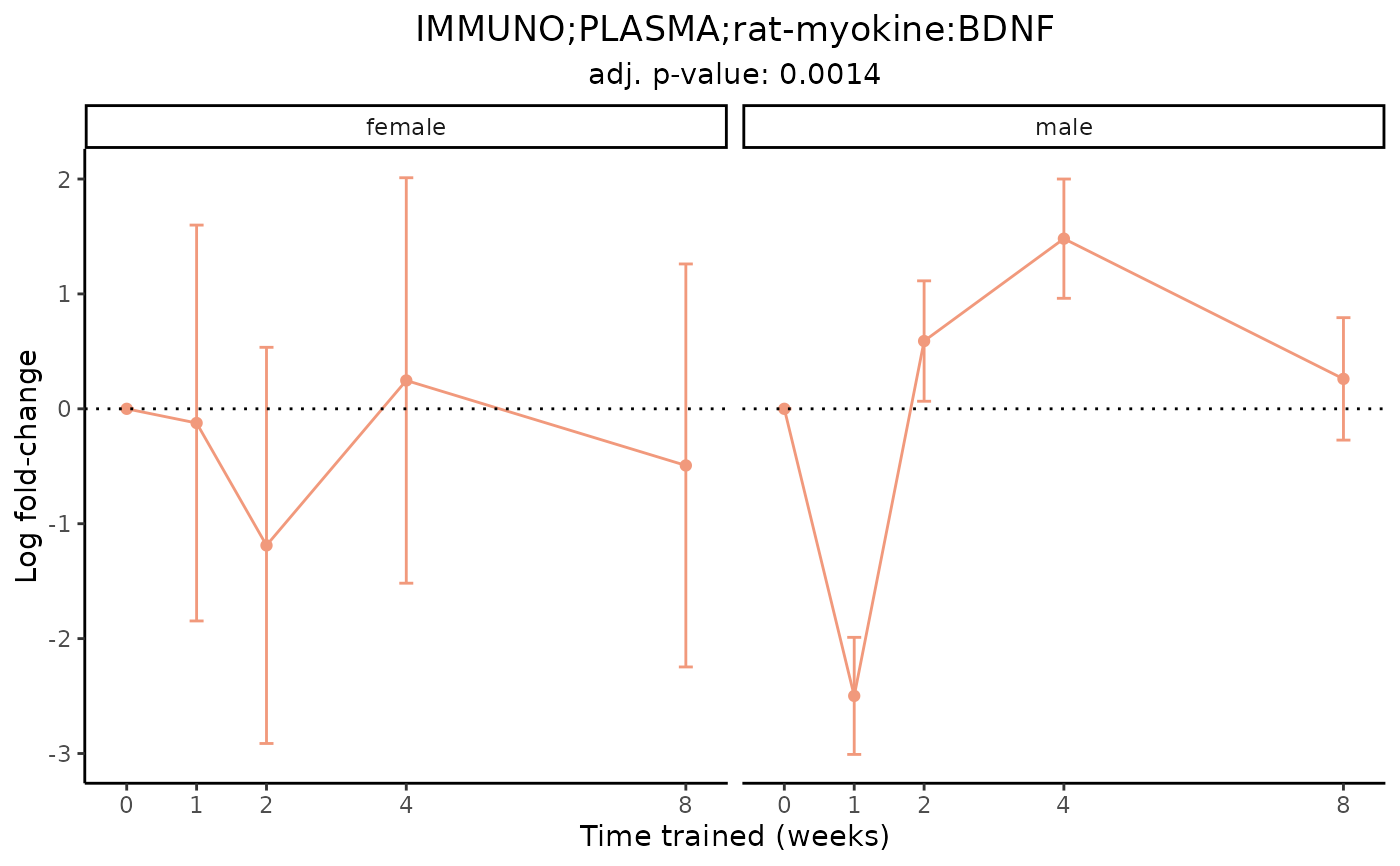
 # Plot a redundant differential feature
plot_feature_logfc(assay = "IMMUNO",
tissue = "PLASMA",
feature_ID = "BDNF",
facet_by_sex = TRUE)
#> IMMUNO_PLASMA_DA
#> Multiple measurements for feature 'IMMUNO;PLASMA;BDNF'. Taking the smallest training-dea FDR for the plot label.
# Plot a redundant differential feature
plot_feature_logfc(assay = "IMMUNO",
tissue = "PLASMA",
feature_ID = "BDNF",
facet_by_sex = TRUE)
#> IMMUNO_PLASMA_DA
#> Multiple measurements for feature 'IMMUNO;PLASMA;BDNF'. Taking the smallest training-dea FDR for the plot label.
 # Plot one measurement of a redundant feature
plot_feature_logfc(assay = "IMMUNO",
tissue = "PLASMA",
feature_ID = "rat-myokine:BDNF",
facet_by_sex = TRUE)
# Plot one measurement of a redundant feature
plot_feature_logfc(assay = "IMMUNO",
tissue = "PLASMA",
feature_ID = "rat-myokine:BDNF",
facet_by_sex = TRUE)
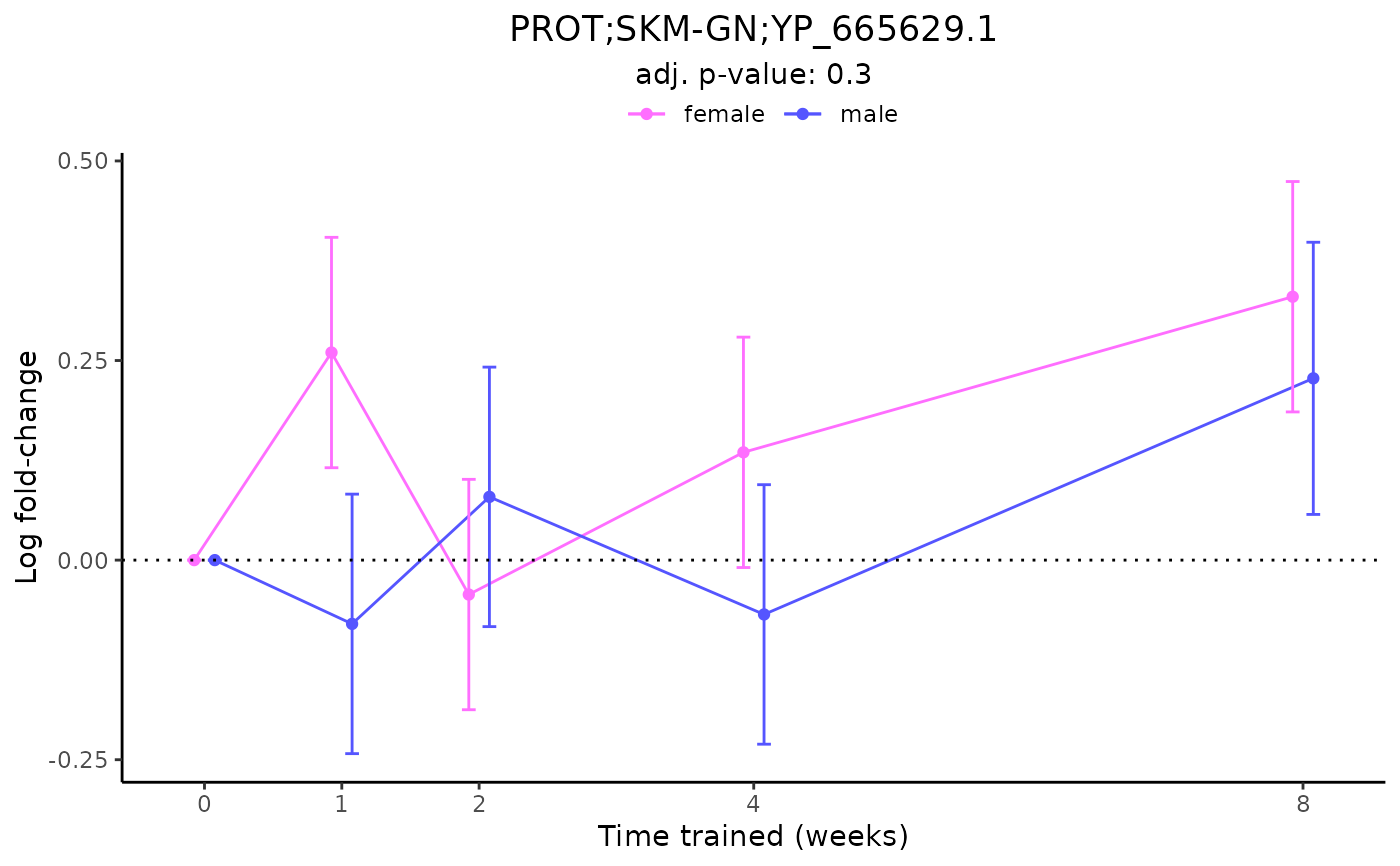
 # Plot a non-differential feature
plot_feature_logfc(assay = "PROT",
tissue = "SKM-GN",
feature_ID = "YP_665629.1")
#> PROT_SKMGN_DA
# Plot a non-differential feature
plot_feature_logfc(assay = "PROT",
tissue = "SKM-GN",
feature_ID = "YP_665629.1")
#> PROT_SKMGN_DA
 # Plot a merged feature from meta-regression, facet by sex,
# don't scale the x-axis, and exclude the training p-value
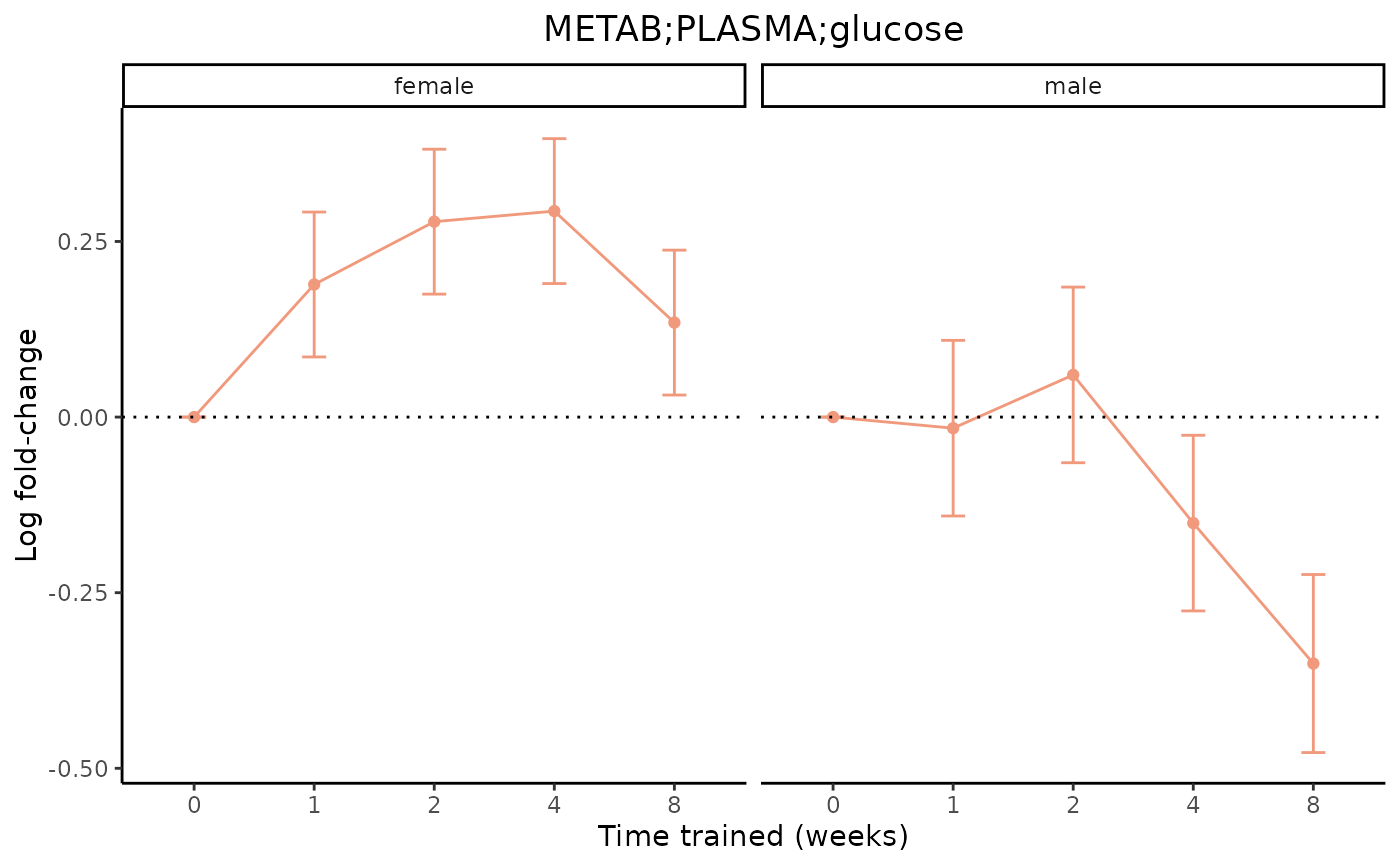
plot_feature_logfc(assay = "METAB",
tissue = "PLASMA",
feature_ID = "glucose",
scale_x_by_time = FALSE,
facet_by_sex = TRUE,
add_adj_p = FALSE)
#> METAB_PLASMA_DA_METAREG
# Plot a merged feature from meta-regression, facet by sex,
# don't scale the x-axis, and exclude the training p-value
plot_feature_logfc(assay = "METAB",
tissue = "PLASMA",
feature_ID = "glucose",
scale_x_by_time = FALSE,
facet_by_sex = TRUE,
add_adj_p = FALSE)
#> METAB_PLASMA_DA_METAREG