Differential Analysis of Omics Datasets
Tyler Sagendorf
01 May, 2024
Source:vignettes/WAT_DA.Rmd
WAT_DA.RmdOverview
We will use a wrapper around functions from the limma
package[1] to perform
differential analysis on several sets of contrasts. See
help("limma_full", package = "MotrpacRatTraining6moWAT")
for more details. Volcano plots are created in a separate article.
# Required packages
library(MotrpacRatTraining6moWATData)
library(MotrpacRatTraining6moWAT) # limma_full
library(dplyr)
library(purrr)
Contrasts to test
# Sex-specific training differences
contr_train <- sprintf("%s_%s - %s_SED",
                       rep(c("F", "M"), each = 4),
                       rep(paste0(2^(0:3), "W"), times = 2),
                       rep(c("F", "M"), each = 4))

# Training-induced sexual dimorphism (sex by timepoint interaction)
contr_diff <- sprintf("(%s) - (%s)",
                      contr_train[5:8],
                      contr_train[1:4])

# List of contrast groups
contr_list <- list("trained_vs_SED" = contr_train,
                   "MvF_SED" = "M_SED - F_SED",
                   "MvF_exercise_response" = contr_diff)
contr_list
#> $trained_vs_SED
#> [1] "F_1W - F_SED" "F_2W - F_SED" "F_4W - F_SED" "F_8W - F_SED" "M_1W - M_SED"
#> [6] "M_2W - M_SED" "M_4W - M_SED" "M_8W - M_SED"
#>
#> $MvF_SED
#> [1] "M_SED - F_SED"
#>
#> $MvF_exercise_response
#> [1] "(M_1W - M_SED) - (F_1W - F_SED)" "(M_2W - M_SED) - (F_2W - F_SED)"
#> [3] "(M_4W - M_SED) - (F_4W - F_SED)" "(M_8W - M_SED) - (F_8W - F_SED)"Proteomics
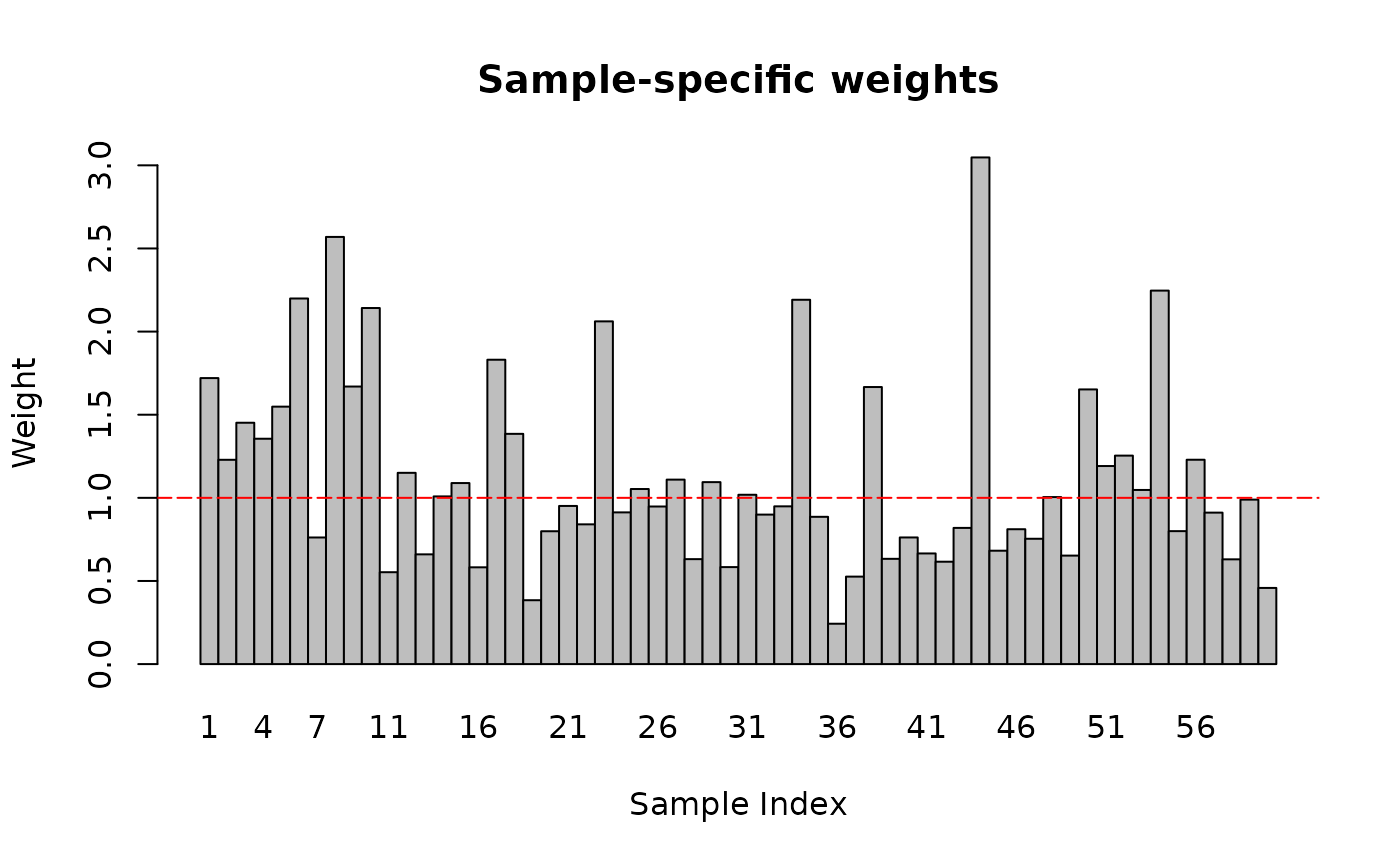
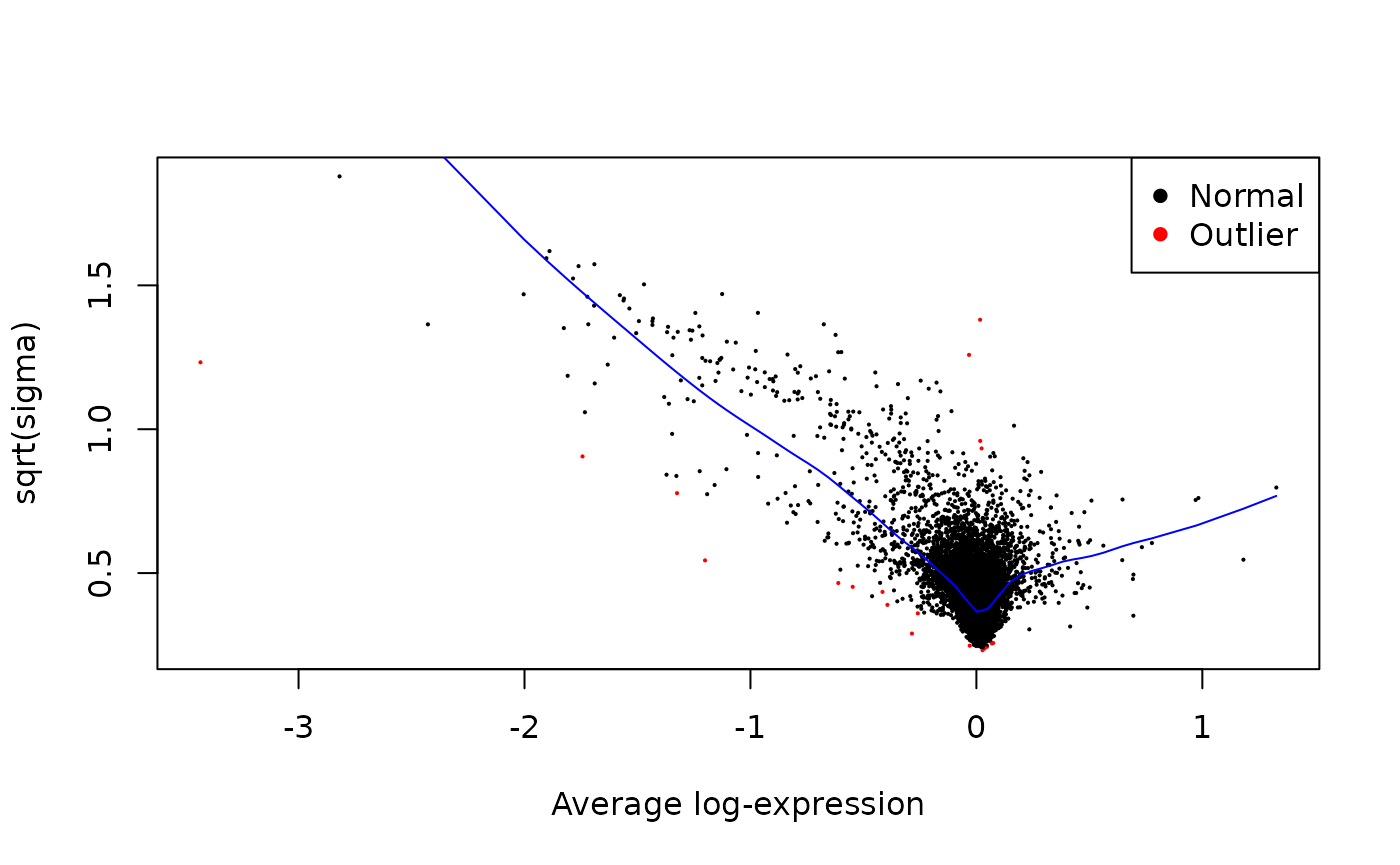
PROT_DA <- map2(contr_list, c(TRUE, FALSE, FALSE), function(contrasts, plot) {
  limma_full(object = PROT_EXP,
             model.str = "~ 0 + exp_group",
             coef.str = "exp_group",
             contrasts = contrasts,
             var.group = "viallabel",
             plot = plot) %>%
    arrange(contrast, feature) %>%
    dplyr::select(-B)
}, .progress = TRUE)

Phosphoproteomics
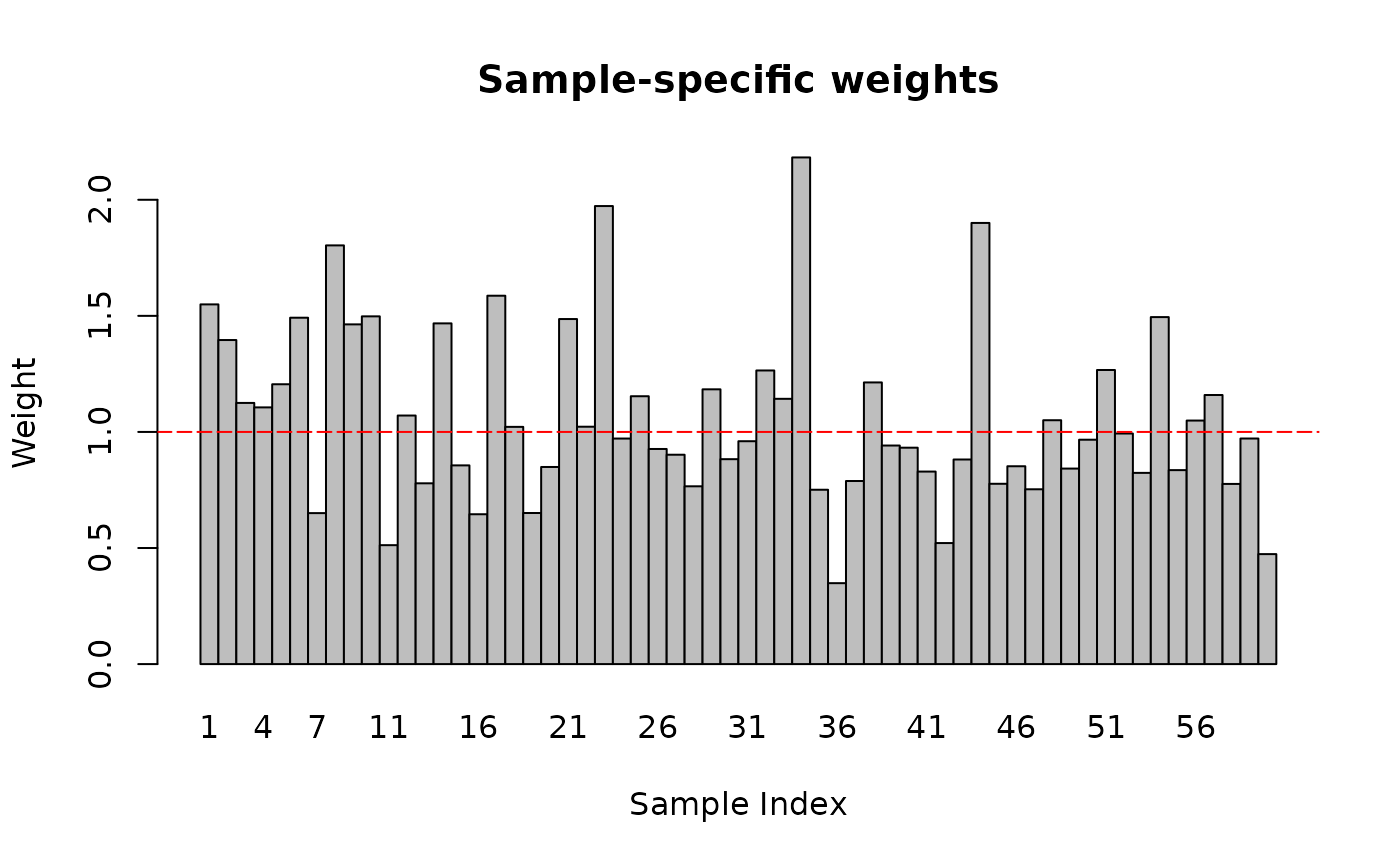
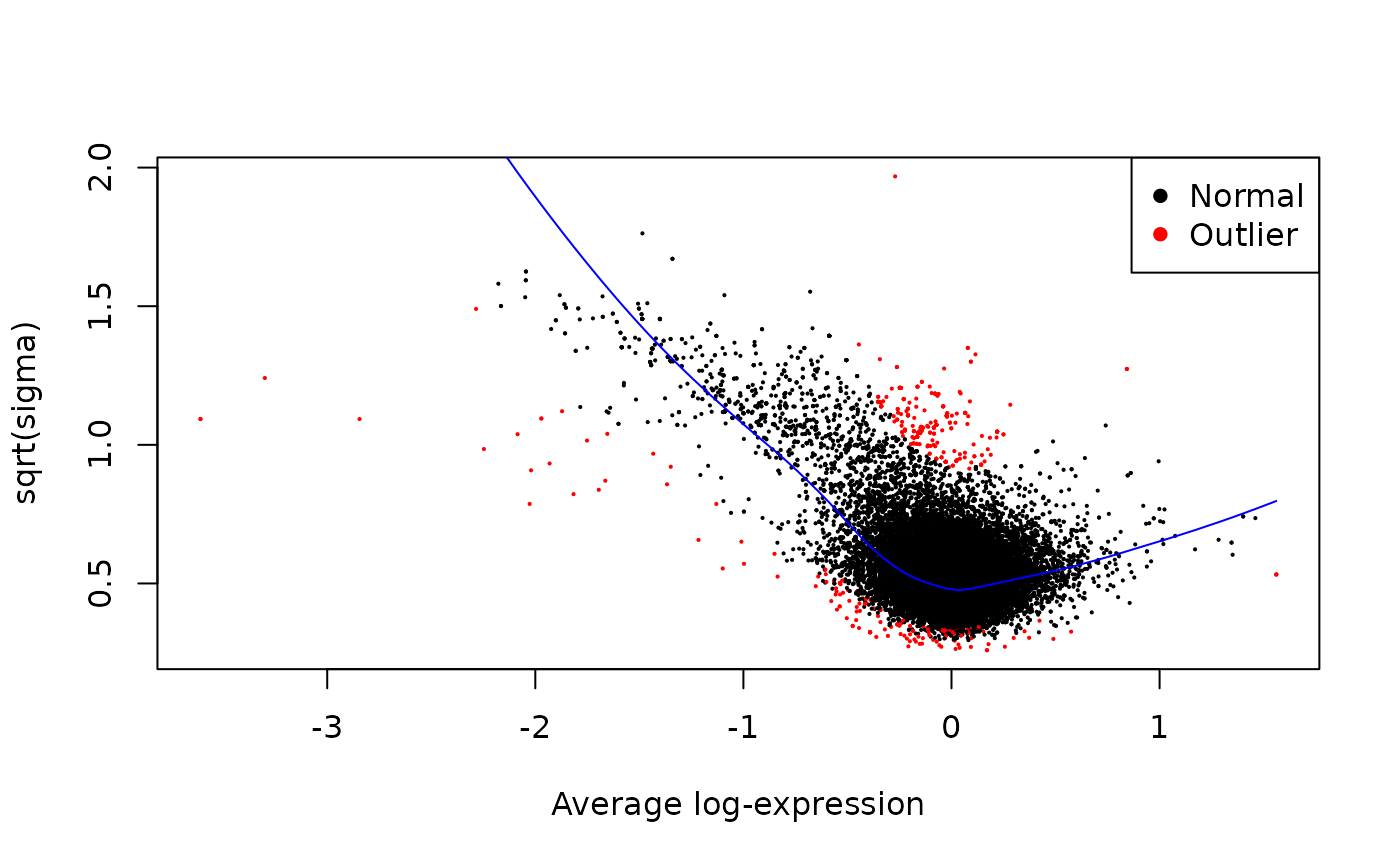
PHOSPHO_DA <- map2(
  contr_list, c(TRUE, FALSE, FALSE), function(contrasts, plot) {
    limma_full(object = PHOSPHO_EXP,
               model.str = "~ 0 + exp_group",
               coef.str = "exp_group",
               contrasts = contrasts,
               var.group = "vialLabel",
               plot = plot) %>%
      arrange(contrast, feature) %>%
      dplyr::select(-B)
  }, .progress = TRUE)

Transcriptomics
# Covariates included in https://doi.org/10.1101/2022.09.21.508770,
# processed in the same way
covariates <- "rin + pct_globin + pct_umi_dup + median_5_3_bias"

TRNSCRPT_DA <- map2(
  contr_list, c(TRUE, FALSE, FALSE), function(contrasts, plot) {
    limma_full(object = TRNSCRPT_EXP,
               model.str = sprintf("~ 0 + exp_group + %s", covariates),
               coef.str = "exp_group",
               contrasts = contrasts,
               var.group = "viallabel",
               plot = plot) %>%
      arrange(contrast, feature) %>%
      dplyr::select(-B)
    # entrez_gene is of type character because of the one-to-many
    # transcript to gene mapping. Keep this in mind.
  })


Metabolomics
We will run differential analysis separately for each platform and then combine the results. This way, we can estimate separate mean-variance trends for each platform.
# Platforms for DEA
assays <- unique(fData(METAB_EXP)[["dataset"]])

# Differential analysis results list
METAB_DA <- map(contr_list, function(contrasts) {
  map(assays, function(assay) {
    message(assay)
    # subset to features in group to model separate mean-variance trends
    METAB_EXP[fData(METAB_EXP)[["dataset"]] == assay, ] %>%
      limma_full(model.str = "~ 0 + exp_group",
                 coef.str = "exp_group",
                 contrasts = contrasts,
                 var.group = "vialLabel") %>%
      arrange(contrast, feature) %>%
      dplyr::select(-B)
  }) %>%
    data.table::rbindlist() %>%
    mutate(contrast = factor(contrast, levels = unique(contrast)),
           adj.P.Val = p.adjust(P.Value, method = "BH")) %>%
    arrange(contrast, feature)
})
# Save results
usethis::use_data(PROT_DA, internal = FALSE, overwrite = TRUE,
                  version = 3, compress = "bzip2")

usethis::use_data(PHOSPHO_DA, internal = FALSE, overwrite = TRUE,
                  version = 3, compress = "bzip2")

usethis::use_data(TRNSCRPT_DA, internal = FALSE, overwrite = TRUE,
                  version = 3, compress = "bzip2")

usethis::use_data(METAB_DA, internal = FALSE, overwrite = TRUE,
                  version = 3, compress = "bzip2")
Session Info
#> R version 4.4.0 (2024-04-24)
#> Platform: x86_64-pc-linux-gnu
#> Running under: Ubuntu 22.04.4 LTS
#>
#> Matrix products: default
#> BLAS:   /usr/lib/x86_64-linux-gnu/openblas-pthread/libblas.so.3
#> LAPACK: /usr/lib/x86_64-linux-gnu/openblas-pthread/libopenblasp-r0.3.20.so;  LAPACK version 3.10.0
#>
#> locale:
#>  [1] LC_CTYPE=C.UTF-8       LC_NUMERIC=C           LC_TIME=C.UTF-8
#>  [4] LC_COLLATE=C.UTF-8     LC_MONETARY=C.UTF-8    LC_MESSAGES=C.UTF-8
#>  [7] LC_PAPER=C.UTF-8       LC_NAME=C              LC_ADDRESS=C
#> [10] LC_TELEPHONE=C         LC_MEASUREMENT=C.UTF-8 LC_IDENTIFICATION=C
#>
#> time zone: UTC
#> tzcode source: system (glibc)
#>
#> attached base packages:
#> [1] stats     graphics  grDevices utils     datasets  methods   base
#>
#> other attached packages:
#> [1] purrr_1.0.2                        dplyr_1.1.4
#> [3] MotrpacRatTraining6moWAT_1.0.1     Biobase_2.64.0
#> [5] BiocGenerics_0.50.0                MotrpacRatTraining6moWATData_2.0.0
#>
#> loaded via a namespace (and not attached):
#>   [1] RColorBrewer_1.1-3      rstudioapi_0.16.0       jsonlite_1.8.8
#>   [4] shape_1.4.6.1           magrittr_2.0.3          ggbeeswarm_0.7.2
#>   [7] rmarkdown_2.26          GlobalOptions_0.1.2     fs_1.6.4
#>  [10] zlibbioc_1.50.0         ragg_1.3.0              vctrs_0.6.5
#>  [13] memoise_2.0.1           base64enc_0.1-3         rstatix_0.7.2
#>  [16] htmltools_0.5.8.1       dynamicTreeCut_1.63-1   curl_5.2.1
#>  [19] broom_1.0.5             Formula_1.2-5           sass_0.4.9
#>  [22] bslib_0.7.0             htmlwidgets_1.6.4       desc_1.4.3
#>  [25] impute_1.78.0           cachem_1.0.8            lifecycle_1.0.4
#>  [28] iterators_1.0.14        pkgconfig_2.0.3         Matrix_1.7-0
#>  [31] R6_2.5.1                fastmap_1.1.1           GenomeInfoDbData_1.2.12
#>  [34] clue_0.3-65             digest_0.6.35           colorspace_2.1-0
#>  [37] patchwork_1.2.0         AnnotationDbi_1.65.2    S4Vectors_0.42.0
#>  [40] textshaping_0.3.7       Hmisc_5.1-2             RSQLite_2.3.6
#>  [43] ggpubr_0.6.0            filelock_1.0.3          latex2exp_0.9.6
#>  [46] fansi_1.0.6             httr_1.4.7              abind_1.4-5
#>  [49] compiler_4.4.0          withr_3.0.0             bit64_4.0.5
#>  [52] doParallel_1.0.17       htmlTable_2.4.2         backports_1.4.1
#>  [55] BiocParallel_1.38.0     carData_3.0-5           DBI_1.2.2
#>  [58] highr_0.10              ggsignif_0.6.4          rjson_0.2.21
#>  [61] tools_4.4.0             vipor_0.4.7             foreign_0.8-86
#>  [64] beeswarm_0.4.0          msigdbr_7.5.1           nnet_7.3-19
#>  [67] glue_1.7.0              grid_4.4.0              checkmate_2.3.1
#>  [70] cluster_2.1.6           fgsea_1.30.0            generics_0.1.3
#>  [73] gtable_0.3.5            preprocessCore_1.66.0   tidyr_1.3.1
#>  [76] data.table_1.15.4       WGCNA_1.72-5            car_3.1-2
#>  [79] utf8_1.2.4              XVector_0.44.0          foreach_1.5.2
#>  [82] pillar_1.9.0            stringr_1.5.1           babelgene_22.9
#>  [85] limma_3.60.0            circlize_0.4.16         splines_4.4.0
#>  [88] BiocFileCache_2.12.0    lattice_0.22-6          survival_3.5-8
#>  [91] bit_4.0.5               tidyselect_1.2.1        GO.db_3.19.1
#>  [94] ComplexHeatmap_2.20.0   locfit_1.5-9.9          Biostrings_2.72.0
#>  [97] knitr_1.46              gridExtra_2.3           IRanges_2.38.0
#> [100] edgeR_4.2.0             stats4_4.4.0            xfun_0.43
#> [103] statmod_1.5.0           matrixStats_1.3.0       stringi_1.8.3
#> [106] UCSC.utils_1.0.0        yaml_2.3.8              evaluate_0.23
#> [109] codetools_0.2-20        tibble_3.2.1            cli_3.6.2
#> [112] ontologyIndex_2.12      rpart_4.1.23            systemfonts_1.0.6
#> [115] munsell_0.5.1           jquerylib_0.1.4         Rcpp_1.0.12
#> [118] GenomeInfoDb_1.40.0     dbplyr_2.5.0            png_0.1-8
#> [121] fastcluster_1.2.6       parallel_4.4.0          pkgdown_2.0.9
#> [124] ggplot2_3.5.1           blob_1.2.4              scales_1.3.0
#> [127] crayon_1.5.2            GetoptLong_1.0.5        rlang_1.1.3
#> [130] cowplot_1.1.3           fastmatch_1.1-4         KEGGREST_1.44.0
References
1. Ritchie, M. E., Phipson, B., Wu, D., Hu, Y., Law, C. W., Shi, W.,
& Smyth, G. K. (2015). limma powers
differential expression analyses for RNA-sequencing and
microarray studies. Nucleic Acids Research, 43(7),
e47. https://doi.org/10.1093/nar/gkv007