Plots of plasma clinical analytes
Tyler Sagendorf
01 May, 2024
Source:vignettes/articles/plot_analytes.Rmd
plot_analytes.RmdThis article generates plots of the plasma clinical analytes (Fig. 1F–I, Extended Data Fig. 1E, F).
# Required packages
library(MotrpacRatTraining6moWAT) # plot_baseline
library(MotrpacRatTraining6moWATData)
library(ggplot2)
library(dplyr)
library(purrr)
library(tidyr)
library(tibble)
library(emmeans)
library(scales)

save_plots <- dir.exists(paths = file.path("..", "..", "plots"))
x <- ANALYTES %>%
  filter(omics_subset) %>%
  dplyr::rename(group = timepoint)

stats_df <- ANALYTES_STATS$timewise

# Reformat confidence interval data
conf_df <- map(ANALYTES_EMM$timewise, function(emm_i) {
  terms_i <- attr(terms(emm_i@model.info), which = "term.labels")

  out <- summary(emm_i) %>%
    as.data.frame() %>%
    dplyr::rename(any_of(c(lower.CL = "asymp.LCL",
                    upper.CL = "asymp.UCL",
                    response_mean = "response",
                    response_mean = "rate")))

  out <- out %>%
    mutate(timepoint = factor(timepoint,
                          levels = c("SED", paste0(2 ^ (0:3), "W"))))

  return(out)
}) %>%
  enframe(name = "response") %>%
  unnest(value) %>%
  dplyr::rename(group = timepoint)
Glucagon
## Glucagon
plot_baseline(x, response = "glucagon",
              conf = filter(conf_df, response == "Glucagon"),
              stats = filter(stats_df, response == "Glucagon"),
              bracket.nudge.y = 12) +
  scale_y_continuous(name = "Glucagon (pM)",
                     breaks = seq(0, 160, 40),
                     expand = expansion(mult = 5e-3)) +
  coord_cartesian(ylim = c(0, 160), clip = "off") +
  theme(plot.margin = margin(t = 4, r = 4, b = 4, l = 4),
        strip.text = element_text(margin = margin(b = 14)))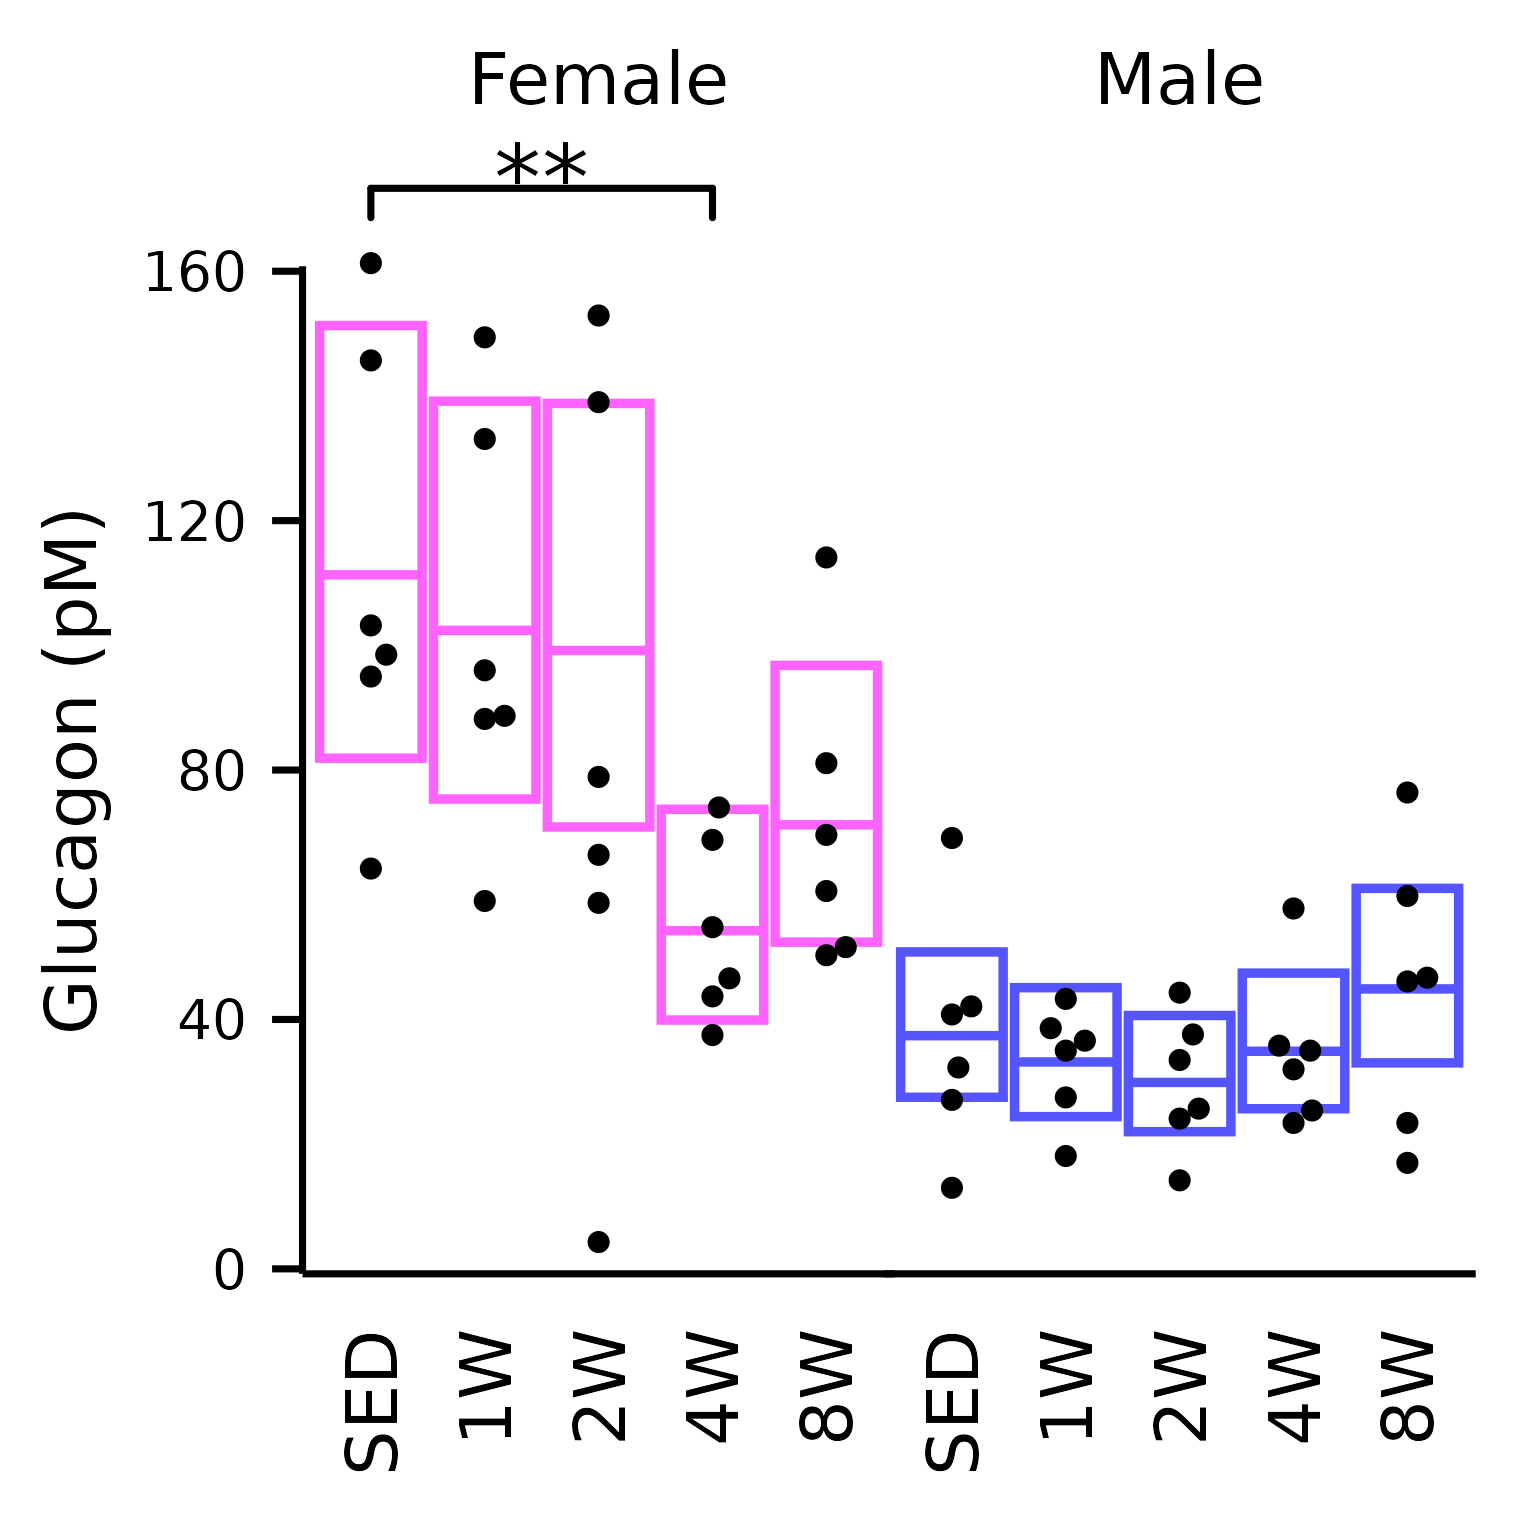
Glucose
## Glucose
plot_baseline(x, response = "glucose",
              conf = filter(conf_df, response == "Glucose"),
              stats = filter(stats_df, response == "Glucose"),
              bracket.nudge.y = 6) +
  scale_y_continuous(name = "Glucose (mg/dL)",
                     expand = expansion(mult = 5e-3)) +
  coord_cartesian(ylim = c(115, 200), clip = "off") +
  theme(plot.margin = margin(t = 4, r = 4, b = 4, l = 4),
        strip.text = element_text(margin = margin(b = 4)))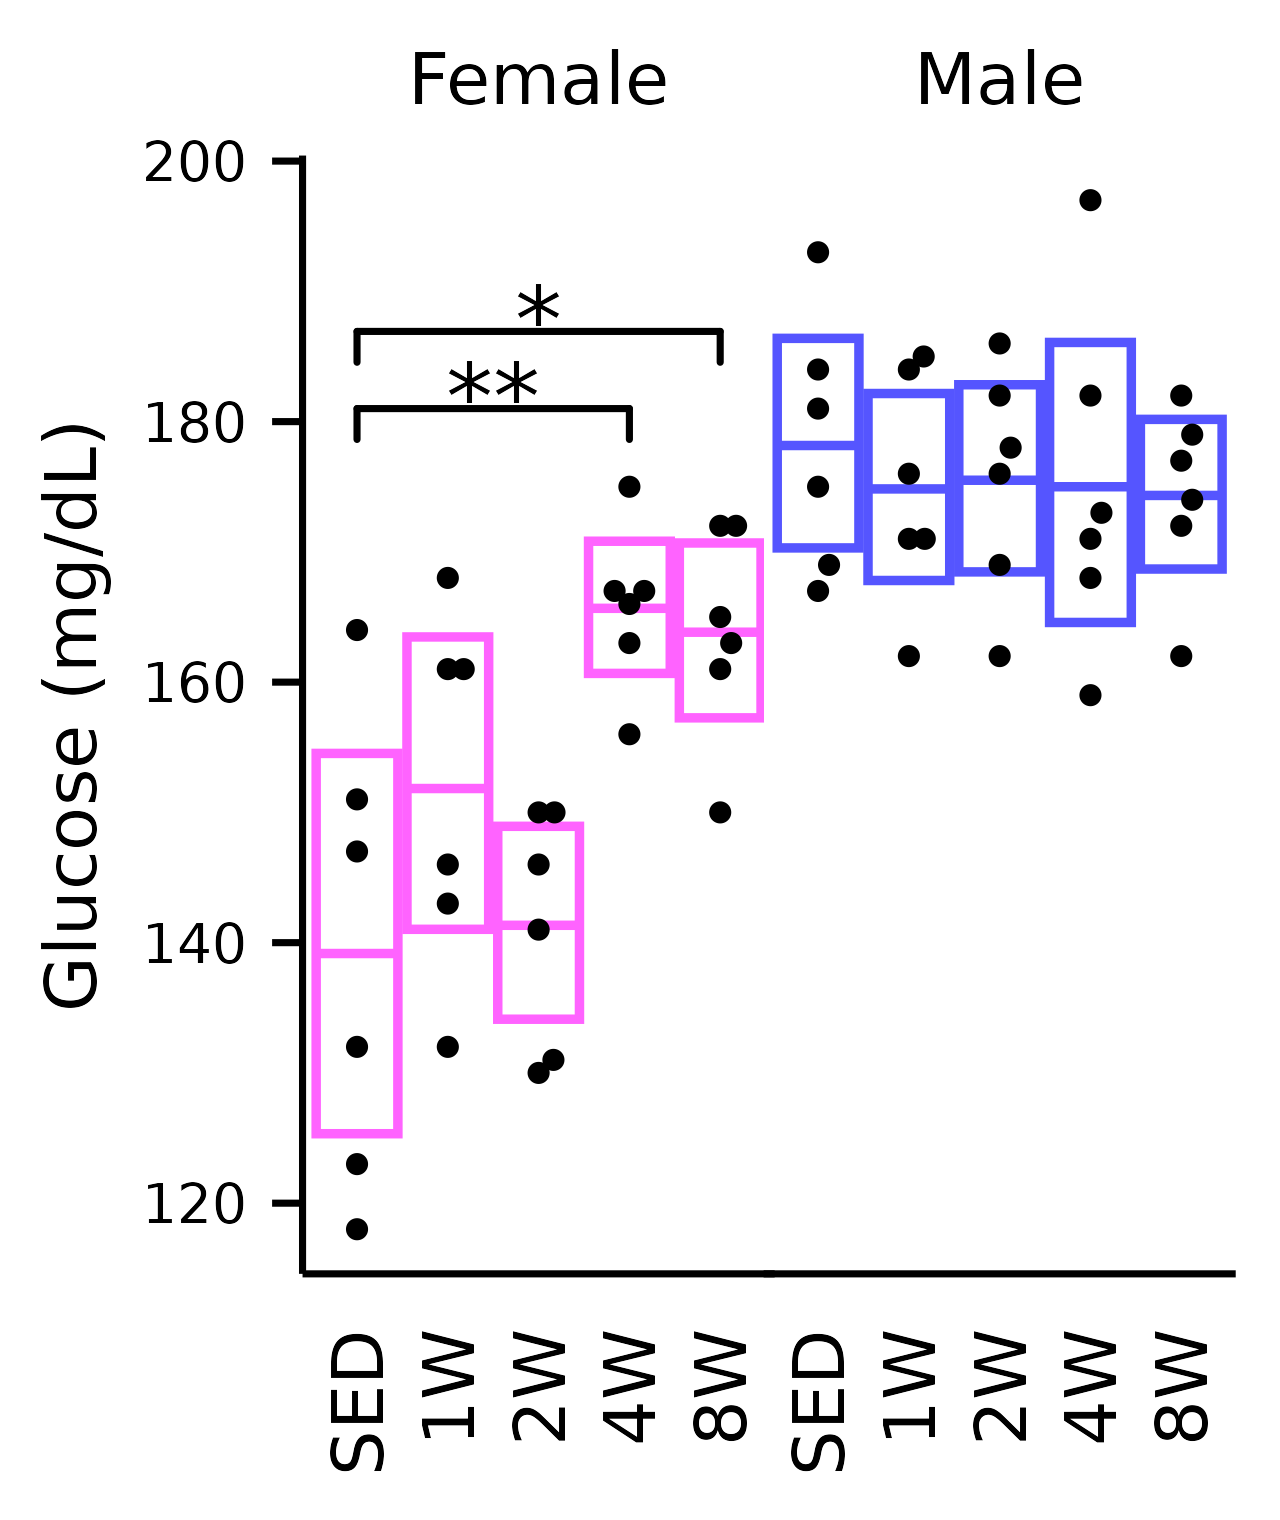
Glycerol
## Glycerol
plot_baseline(x, response = "glycerol",
              conf = filter(conf_df, response == "Glycerol"),
              stats = filter(stats_df, response == "Glycerol"),
              bracket.nudge.y = 0.2) +
  scale_y_continuous(name = "Glycerol (mg/dL)",
                     expand = expansion(mult = 5e-3)) +
  coord_cartesian(ylim = c(0, 3), clip = "off") +
  theme(plot.margin = margin(t = 4, r = 4, b = 4, l = 4),
        strip.text = element_text(margin = margin(b = 5)))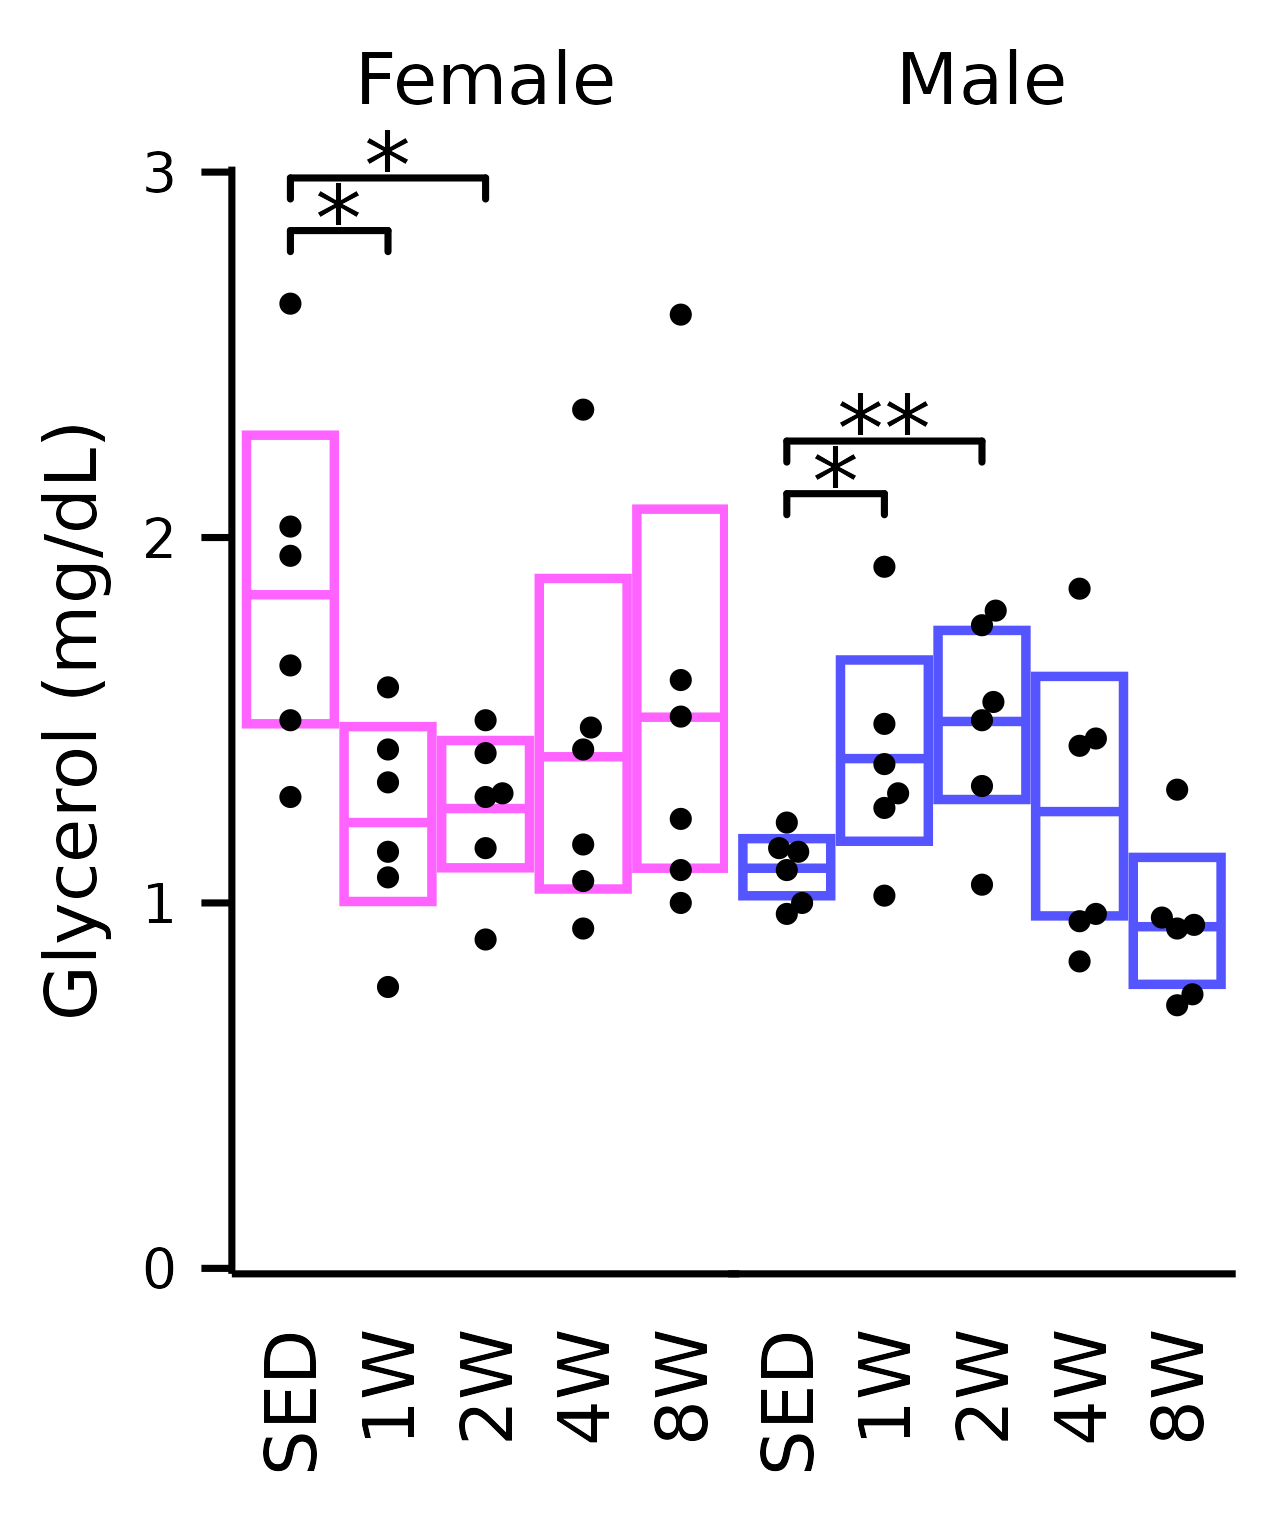
Insulin
## Insulin
plot_baseline(x, response = "insulin_iu",
              bracket.nudge.y = 10) +
  scale_y_continuous(name = "Insulin (mg/dL)",
                     expand = expansion(mult = 5e-3),
                     breaks = seq(20, 140, 20),
                     sec.axis = sec_axis(name = "Insulin (pg/mL)",
                                         trans = ~ .x / 0.023,
                                         breaks = 1000 * 1:6)) +
  coord_cartesian(ylim = c(20, 140), clip = "off") +
  theme(plot.margin = margin(t = 4, r = 4, b = 4, l = 4),
        strip.text = element_text(margin = margin(b = 5)))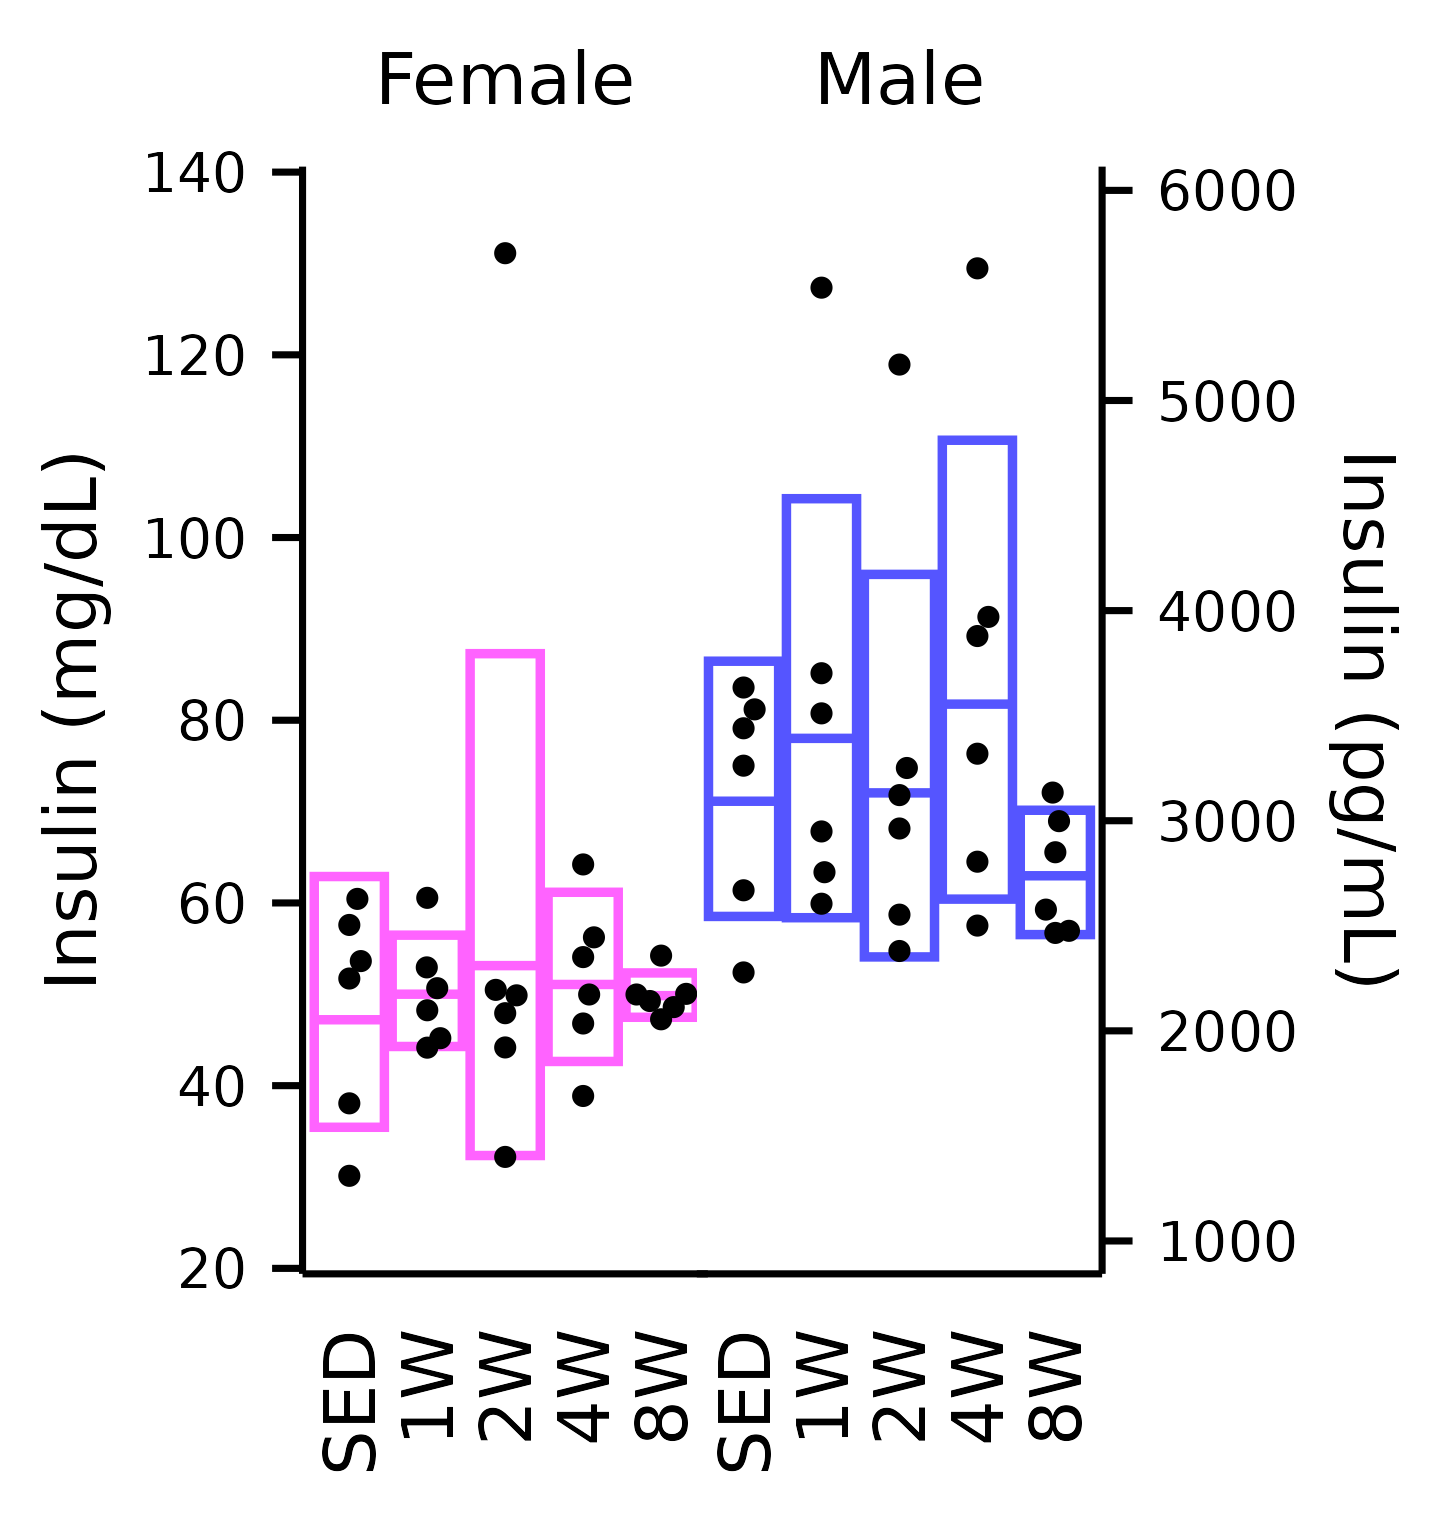
Leptin
## Leptin
plot_baseline(x, response = "leptin",
              conf = filter(conf_df, response == "Leptin"),
              stats = filter(stats_df, response == "Leptin"),
              bracket.nudge.y = 1e4 / 3) +
  scale_y_continuous(name = "Leptin (pg/mL)",
                     labels = scales::label_scientific(digits = 1),
                     expand = expansion(mult = 5e-3)) +
  coord_cartesian(ylim = c(0, 6e4), clip = "off") +
  theme(plot.margin = margin(t = 4, r = 4, b = 4, l = 4),
        strip.text = element_text(margin = margin(b = 14)))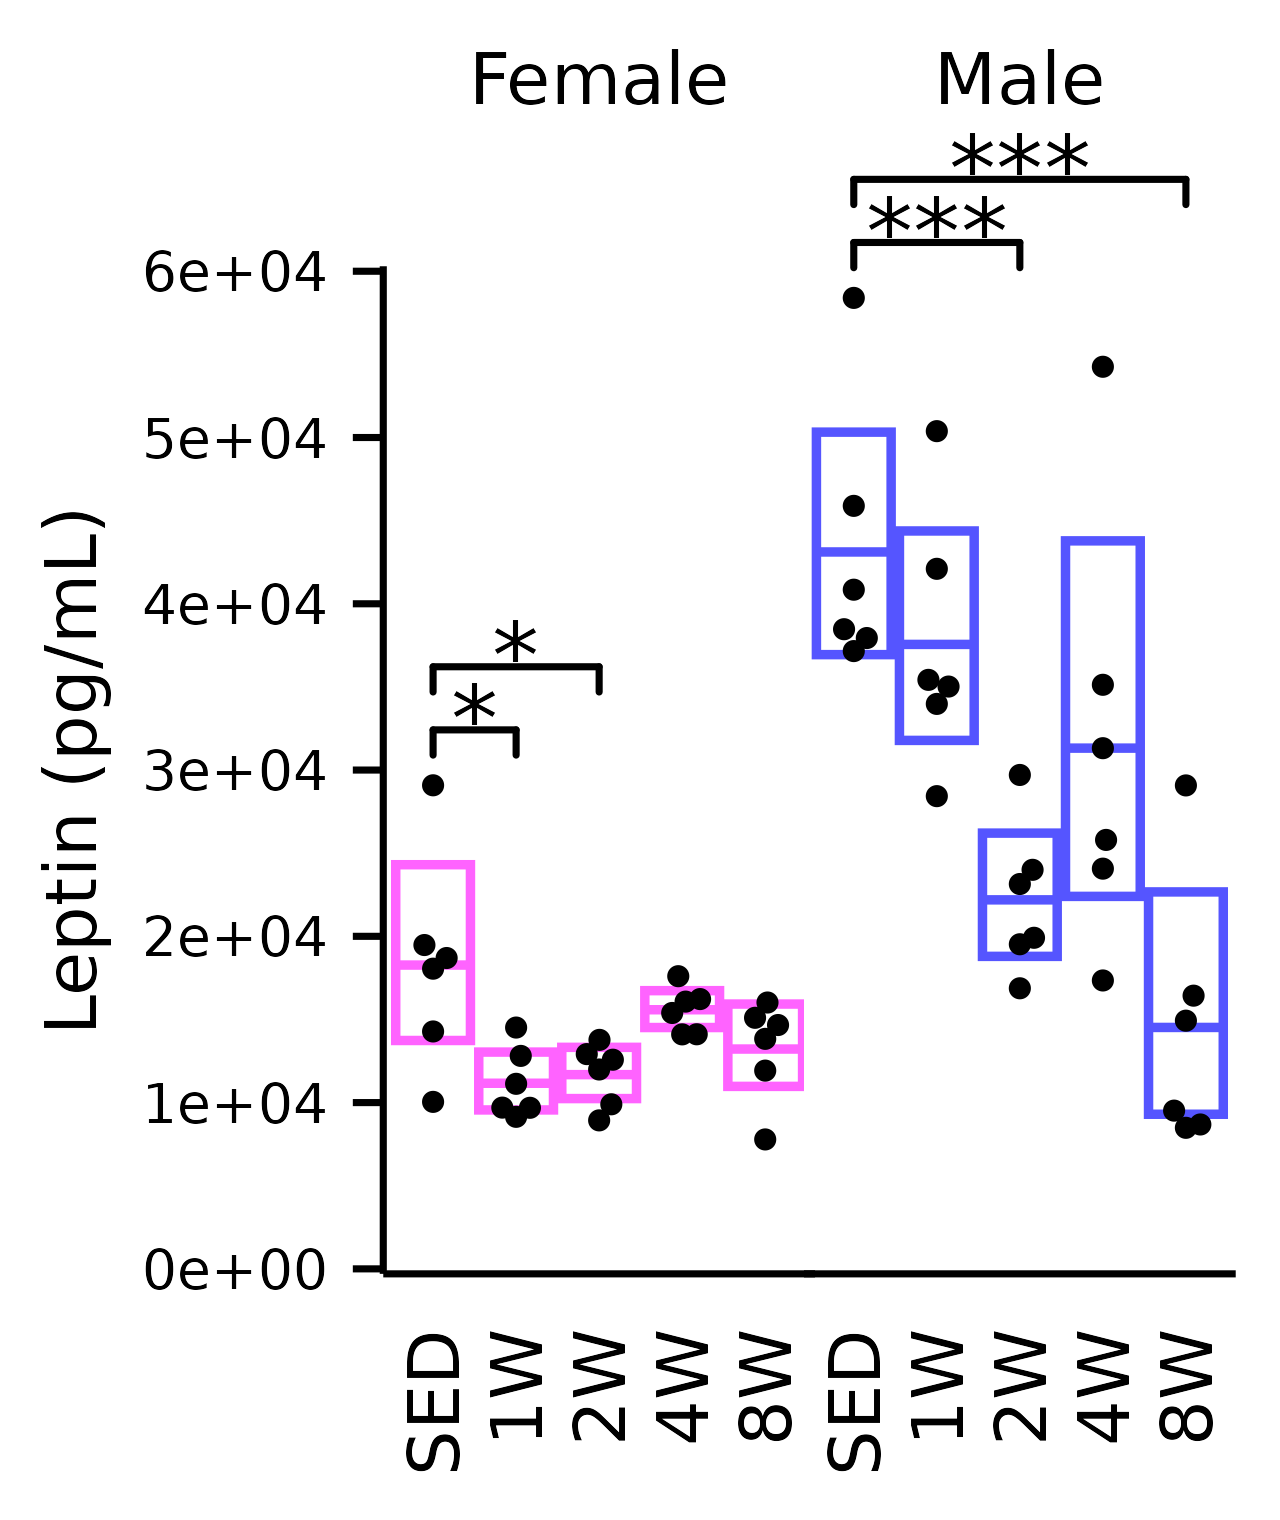
NEFA
## NEFA
plot_baseline(x, response = "nefa",
              conf = filter(conf_df, response == "NEFA"),
              stats = filter(stats_df, response == "NEFA"),
              bracket.nudge.y = 0.1) +
  scale_y_continuous(name = "NEFA (mmol/L)",
                     breaks = seq(0.3, 1.3, 0.2),
                     expand = expansion(mult = 5e-3)) +
  coord_cartesian(ylim = c(0.3, 1.3), clip = "off") +
  theme(plot.margin = margin(t = 4, r = 4, b = 4, l = 4),
        strip.text = element_text(margin = margin(b = 10)))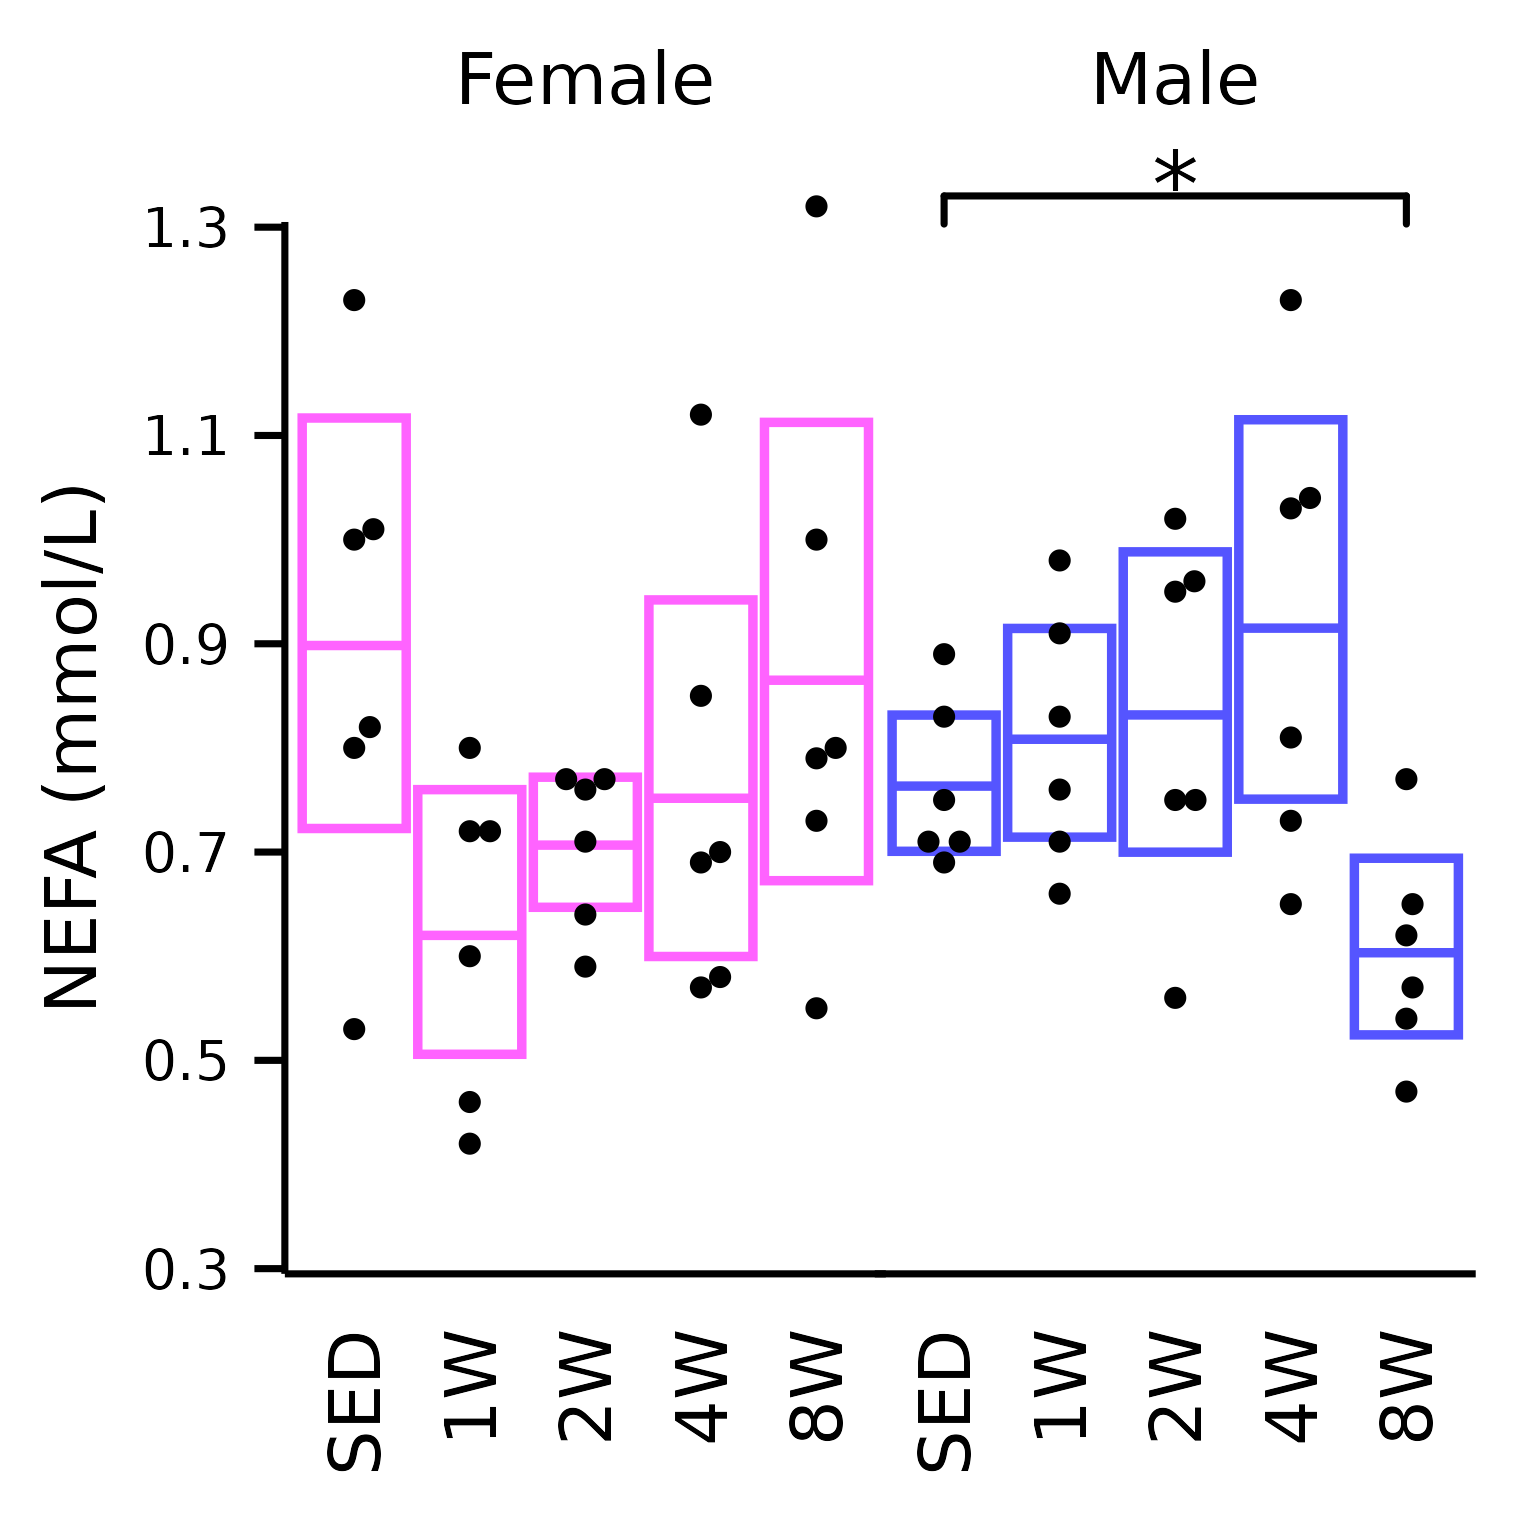
Session Info
sessionInfo()
#> R version 4.4.0 (2024-04-24)
#> Platform: x86_64-pc-linux-gnu
#> Running under: Ubuntu 22.04.4 LTS
#>
#> Matrix products: default
#> BLAS:   /usr/lib/x86_64-linux-gnu/openblas-pthread/libblas.so.3
#> LAPACK: /usr/lib/x86_64-linux-gnu/openblas-pthread/libopenblasp-r0.3.20.so;  LAPACK version 3.10.0
#>
#> locale:
#>  [1] LC_CTYPE=C.UTF-8       LC_NUMERIC=C           LC_TIME=C.UTF-8
#>  [4] LC_COLLATE=C.UTF-8     LC_MONETARY=C.UTF-8    LC_MESSAGES=C.UTF-8
#>  [7] LC_PAPER=C.UTF-8       LC_NAME=C              LC_ADDRESS=C
#> [10] LC_TELEPHONE=C         LC_MEASUREMENT=C.UTF-8 LC_IDENTIFICATION=C
#>
#> time zone: UTC
#> tzcode source: system (glibc)
#>
#> attached base packages:
#> [1] stats     graphics  grDevices utils     datasets  methods   base
#>
#> other attached packages:
#>  [1] scales_1.3.0                       emmeans_1.10.1
#>  [3] tibble_3.2.1                       tidyr_1.3.1
#>  [5] purrr_1.0.2                        dplyr_1.1.4
#>  [7] ggplot2_3.5.1                      MotrpacRatTraining6moWATData_2.0.0
#>  [9] MotrpacRatTraining6moWAT_1.0.1     Biobase_2.64.0
#> [11] BiocGenerics_0.50.0
#>
#> loaded via a namespace (and not attached):
#>   [1] RColorBrewer_1.1-3      rstudioapi_0.16.0       jsonlite_1.8.8
#>   [4] shape_1.4.6.1           magrittr_2.0.3          estimability_1.5
#>   [7] ggbeeswarm_0.7.2        farver_2.1.1            rmarkdown_2.26
#>  [10] GlobalOptions_0.1.2     fs_1.6.4                zlibbioc_1.50.0
#>  [13] ragg_1.3.0              vctrs_0.6.5             memoise_2.0.1
#>  [16] base64enc_0.1-3         rstatix_0.7.2           htmltools_0.5.8.1
#>  [19] dynamicTreeCut_1.63-1   curl_5.2.1              broom_1.0.5
#>  [22] Formula_1.2-5           sass_0.4.9              bslib_0.7.0
#>  [25] htmlwidgets_1.6.4       desc_1.4.3              impute_1.78.0
#>  [28] cachem_1.0.8            lifecycle_1.0.4         iterators_1.0.14
#>  [31] pkgconfig_2.0.3         Matrix_1.7-0            R6_2.5.1
#>  [34] fastmap_1.1.1           GenomeInfoDbData_1.2.12 clue_0.3-65
#>  [37] digest_0.6.35           colorspace_2.1-0        patchwork_1.2.0
#>  [40] AnnotationDbi_1.65.2    S4Vectors_0.42.0        textshaping_0.3.7
#>  [43] Hmisc_5.1-2             RSQLite_2.3.6           ggpubr_0.6.0
#>  [46] labeling_0.4.3          filelock_1.0.3          latex2exp_0.9.6
#>  [49] fansi_1.0.6             httr_1.4.7              abind_1.4-5
#>  [52] compiler_4.4.0          withr_3.0.0             bit64_4.0.5
#>  [55] doParallel_1.0.17       htmlTable_2.4.2         backports_1.4.1
#>  [58] BiocParallel_1.38.0     carData_3.0-5           DBI_1.2.2
#>  [61] highr_0.10              ggsignif_0.6.4          rjson_0.2.21
#>  [64] tools_4.4.0             vipor_0.4.7             foreign_0.8-86
#>  [67] beeswarm_0.4.0          msigdbr_7.5.1           nnet_7.3-19
#>  [70] glue_1.7.0              grid_4.4.0              checkmate_2.3.1
#>  [73] cluster_2.1.6           fgsea_1.30.0            generics_0.1.3
#>  [76] gtable_0.3.5            preprocessCore_1.66.0   data.table_1.15.4
#>  [79] WGCNA_1.72-5            car_3.1-2               utf8_1.2.4
#>  [82] XVector_0.44.0          foreach_1.5.2           pillar_1.9.0
#>  [85] stringr_1.5.1           babelgene_22.9          limma_3.60.0
#>  [88] circlize_0.4.16         splines_4.4.0           BiocFileCache_2.12.0
#>  [91] lattice_0.22-6          survival_3.5-8          bit_4.0.5
#>  [94] tidyselect_1.2.1        GO.db_3.19.1            ComplexHeatmap_2.20.0
#>  [97] locfit_1.5-9.9          Biostrings_2.72.0       knitr_1.46
#> [100] gridExtra_2.3           IRanges_2.38.0          edgeR_4.2.0
#> [103] stats4_4.4.0            xfun_0.43               statmod_1.5.0
#> [106] matrixStats_1.3.0       stringi_1.8.3           UCSC.utils_1.0.0
#> [109] yaml_2.3.8              evaluate_0.23           codetools_0.2-20
#> [112] cli_3.6.2               ontologyIndex_2.12      rpart_4.1.23
#> [115] systemfonts_1.0.6       munsell_0.5.1           jquerylib_0.1.4
#> [118] Rcpp_1.0.12             GenomeInfoDb_1.40.0     dbplyr_2.5.0
#> [121] png_0.1-8               fastcluster_1.2.6       parallel_4.4.0
#> [124] pkgdown_2.0.9           blob_1.2.4              mvtnorm_1.2-4
#> [127] crayon_1.5.2            GetoptLong_1.0.5        rlang_1.1.3
#> [130] cowplot_1.1.3           fastmatch_1.1-4         KEGGREST_1.44.0