Plots of plasma clinical analytes
Tyler Sagendorf
01 May, 2024
Source:vignettes/articles/analyte_plots.Rmd
analyte_plots.Rmd
# Required packages
library(MotrpacRatTrainingPhysiologyData)
library(dplyr)
library(tibble)
library(tidyr)
library(purrr)
library(ggplot2)
library(latex2exp)
Overview
This article generates all plasma clinical analyte figures. A bracket
indicates a significant difference (Dunnett’s test p-value < 0.05)
between the means of the SED group and a trained group (1W, 2W, 4W, 8W).
Plots are generated for each combination of age and sex and such that
the y-axis limits for the same analyte are identical. This allows for
easier visual comparisons. Please refer to the “Statistical analyses of
plasma clinical analytes” vignette for code to generate
ANALYTES_STATS.
Data Preparation:
We apply the summary method to each emmGrid
object and rename columns to work with plot_baseline. Since
the formula for corticosterone did not include age as a
predictor, the entries for the age column are
NA. We instead modify these entries to include both levels
of age separated by a comma. Using this, we can separate
the rows to effectively duplicate the results so that we now have
corticosterone data for both ages. Lastly, we ensure that
group is a factor to preserve the order when plotting. This
list of objects is then converted to a single data.frame
with the response column specifying which analyte is being
tested.
# Reformat confidence interval data
conf_df <- map(ANALYTES_EMM, function(emm_i) {
  terms_i <- attr(terms(emm_i@model.info), which = "term.labels")

  out <- summary(emm_i) %>%
    as.data.frame() %>%
    rename(any_of(c(lower.CL = "asymp.LCL",
                    upper.CL = "asymp.UCL",
                    response_mean = "response",
                    response_mean = "rate")))

  # In some cases, age or sex is not included in the model, so their entries
  # would be NA. We will instead duplicate those rows for plotting.
  # This was already done for ANALYTES_STATS.
  if (!"age" %in% colnames(out)) {
    out$age <- "6M, 18M"
  }

  out <- out %>%
    separate_longer_delim(cols = age, delim = ", ") %>%
    mutate(group = factor(group, levels = c("SED", paste0(2 ^ (0:3), "W"))))

  return(out)
}) %>%
  enframe(name = "response") %>%
  unnest(value)
Corticosterone
Corticosterone (ng/mL).
6M Female
plot_baseline(ANALYTES,
              response = "corticosterone",
              conf = filter(conf_df, response == "Corticosterone"),
              stats = filter(ANALYTES_STATS, response == "Corticosterone"),
              sex = "Female", age = "6M") +
  scale_y_continuous(name = "Corticosterone (ng/mL)",
                     breaks = seq(0, 170, 40),
                     expand = expansion(mult = 1e-2)) +
  coord_cartesian(ylim = c(0, 170), clip = "off") +
  theme(plot.margin = unit(c(20, 5, 5, 5), units = "pt"))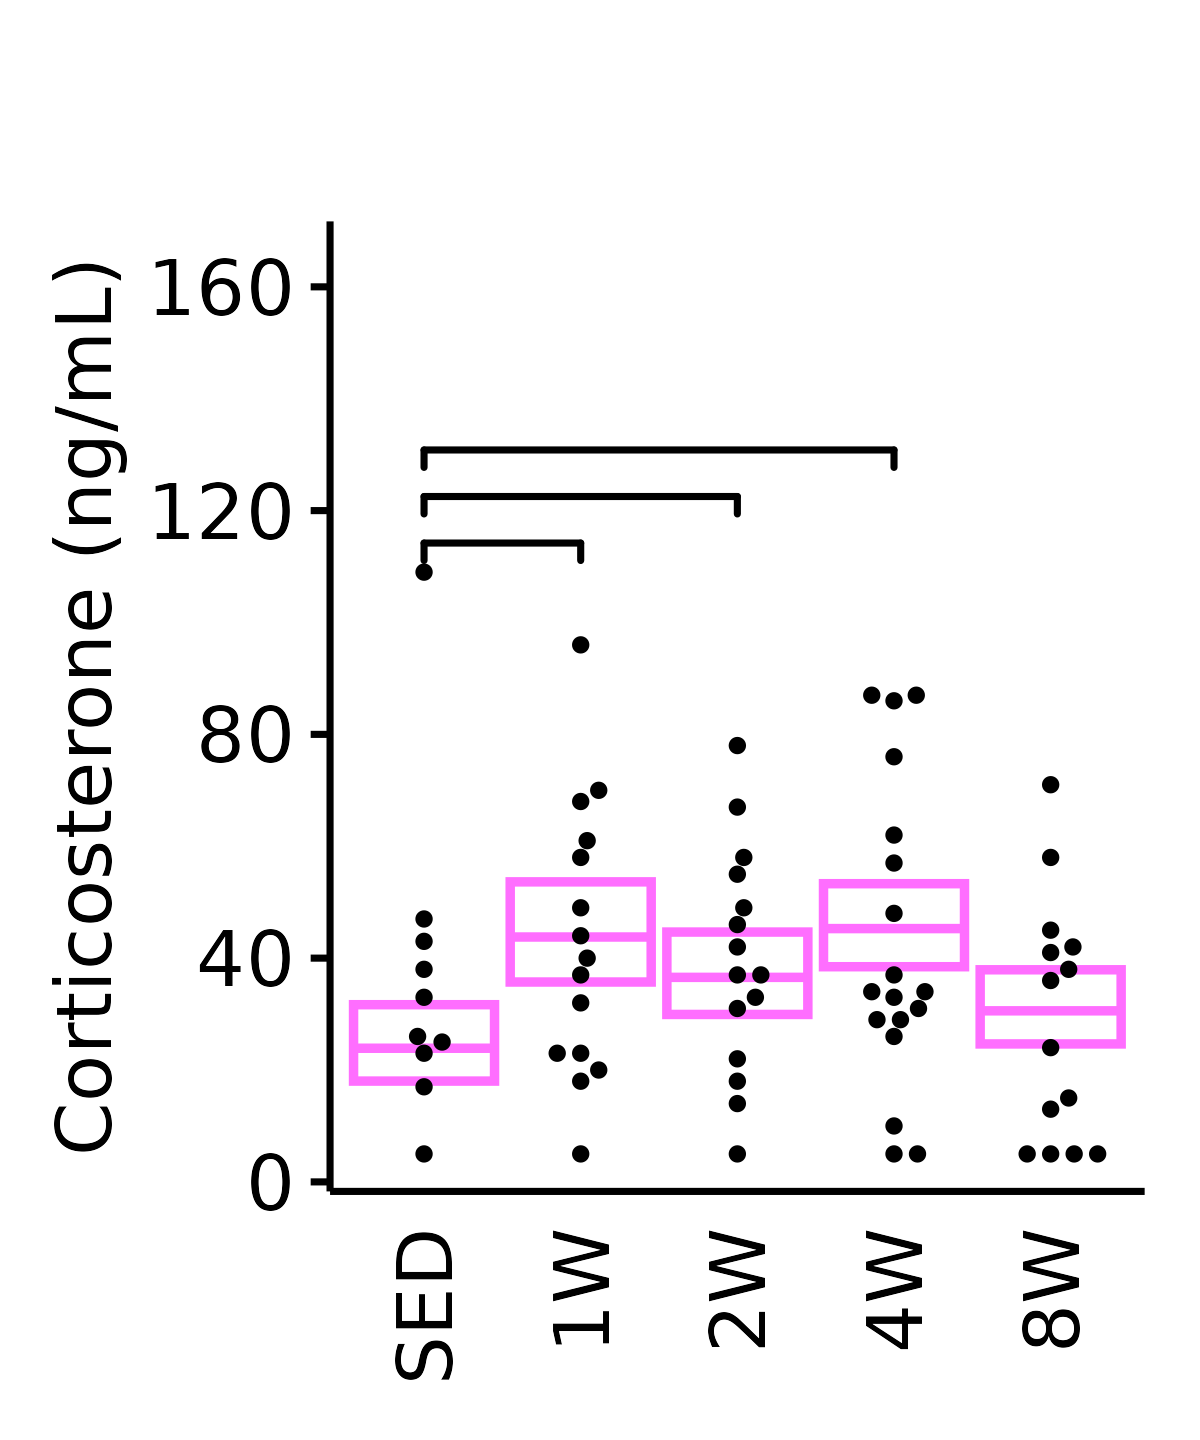
6M Male
plot_baseline(ANALYTES,
              response = "corticosterone",
              conf = filter(conf_df, response == "Corticosterone"),
              stats = filter(ANALYTES_STATS,
                             response == "Corticosterone"),
              sex = "Male", age = "6M", y_position = 145) +
  scale_y_continuous(name = "Corticosterone (ng/mL)",
                     breaks = seq(0, 170, 40),
                     expand = expansion(mult = 1e-2)) +
  coord_cartesian(ylim = c(0, 170), clip = "off") +
  theme(plot.margin = unit(c(20, 5, 5, 5), units = "pt"))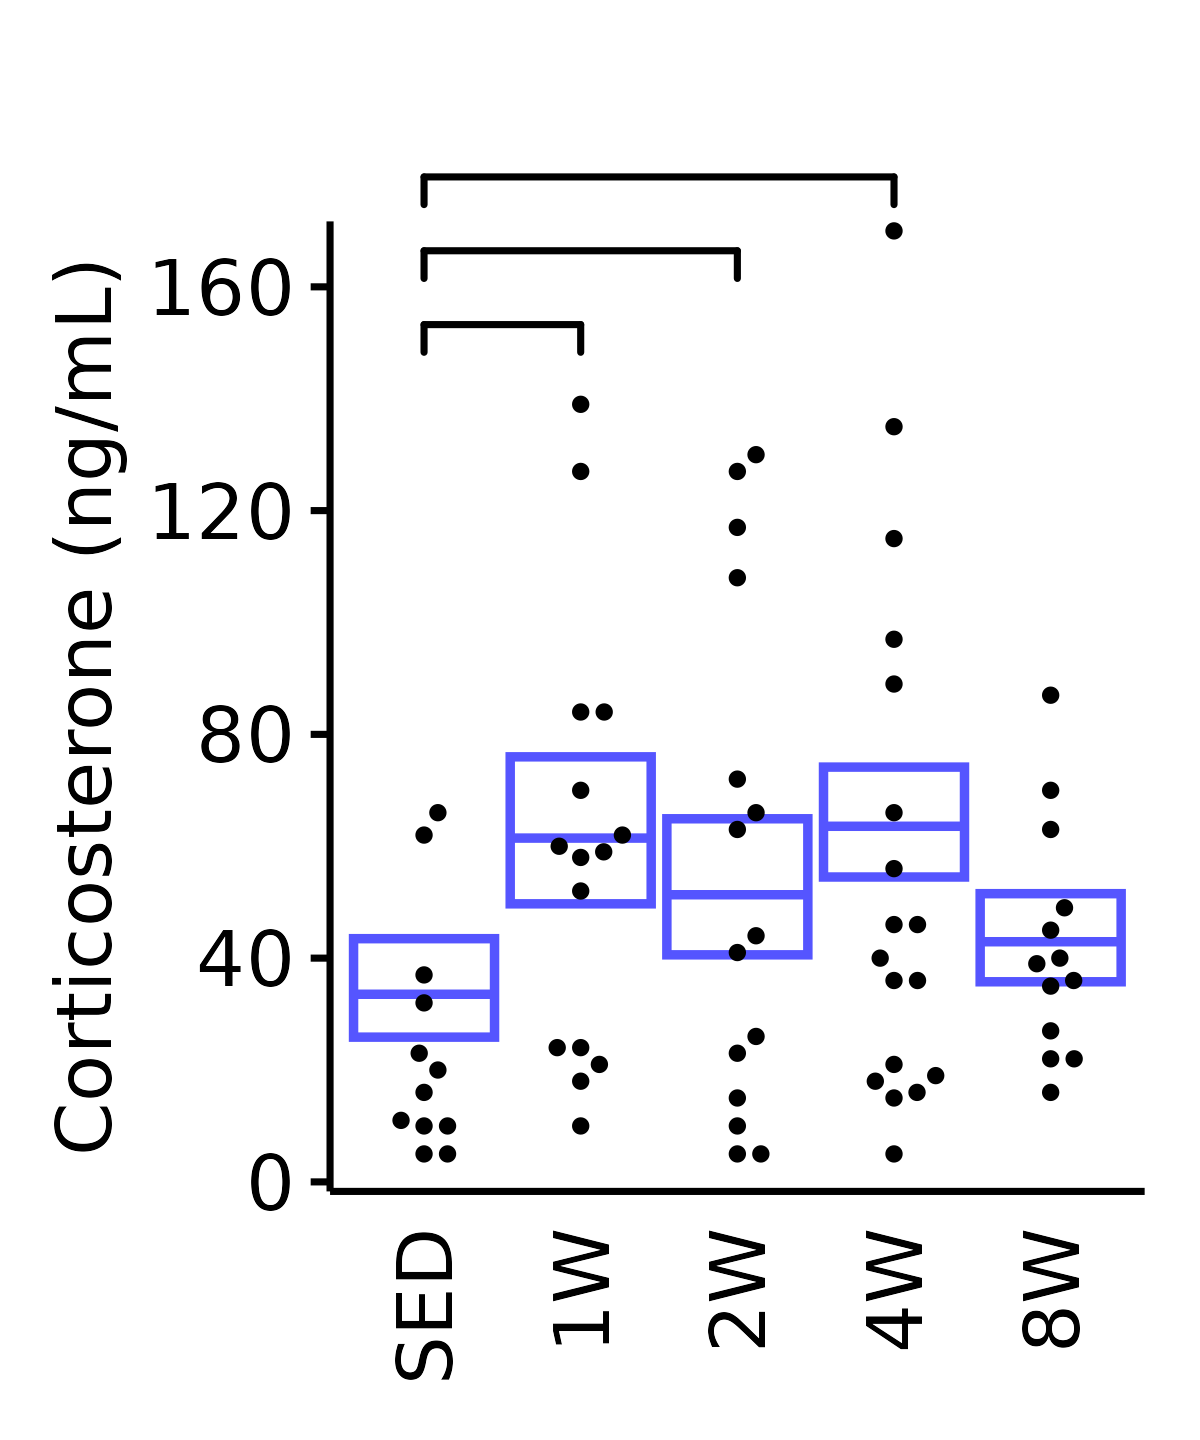
18M Female
plot_baseline(ANALYTES,
              response = "corticosterone",
              conf = filter(conf_df, response == "Corticosterone"),
              stats = filter(ANALYTES_STATS,
                             response == "Corticosterone"),
              sex = "Female", age = "18M", y_position = 75) +
  scale_y_continuous(name = "Corticosterone (ng/mL)",
                     breaks = seq(0, 170, 40),
                     expand = expansion(mult = 1e-2)) +
  coord_cartesian(ylim = c(0, 170), clip = "off") +
  theme(plot.margin = unit(c(20, 5, 5, 5), units = "pt"))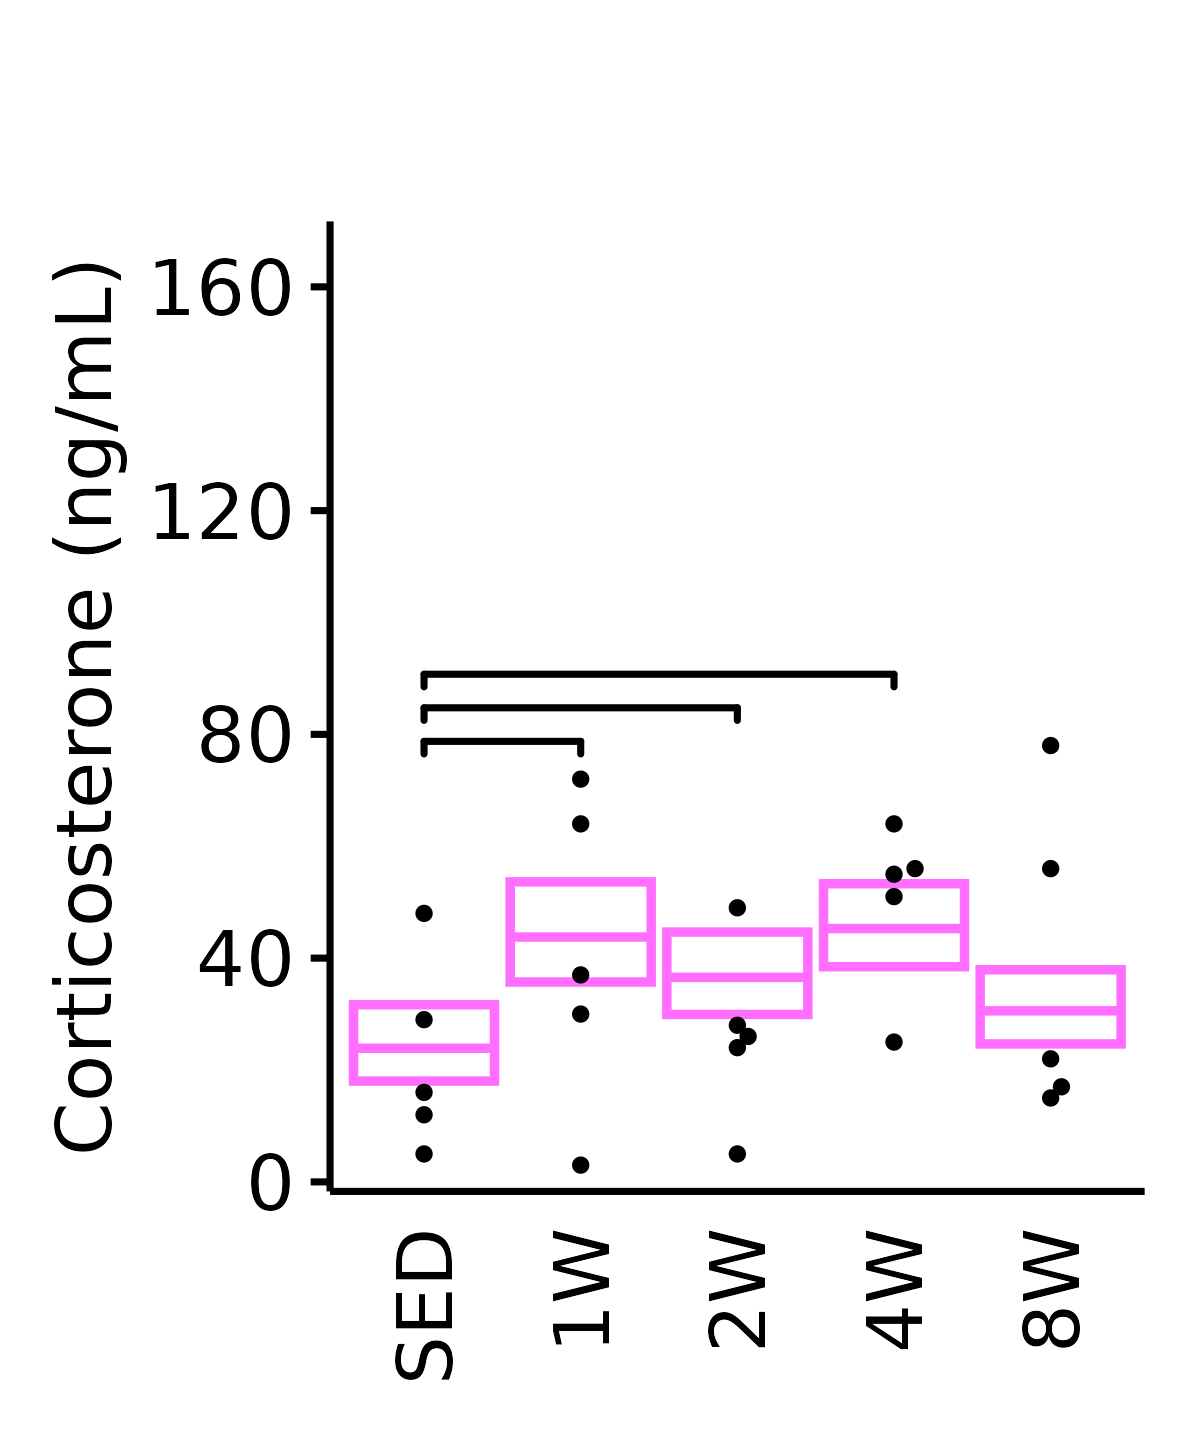
18M Male
plot_baseline(ANALYTES,
              response = "corticosterone",
              conf = filter(conf_df, response == "Corticosterone"),
              stats = filter(ANALYTES_STATS,
                             response == "Corticosterone"),
              sex = "Male", age = "18M") +
  scale_y_continuous(name = "Corticosterone (ng/mL)",
                     breaks = seq(0, 170, 40),
                     expand = expansion(mult = 1e-2)) +
  coord_cartesian(ylim = c(0, 170), clip = "off") +
  theme(plot.margin = unit(c(20, 5, 5, 5), units = "pt"))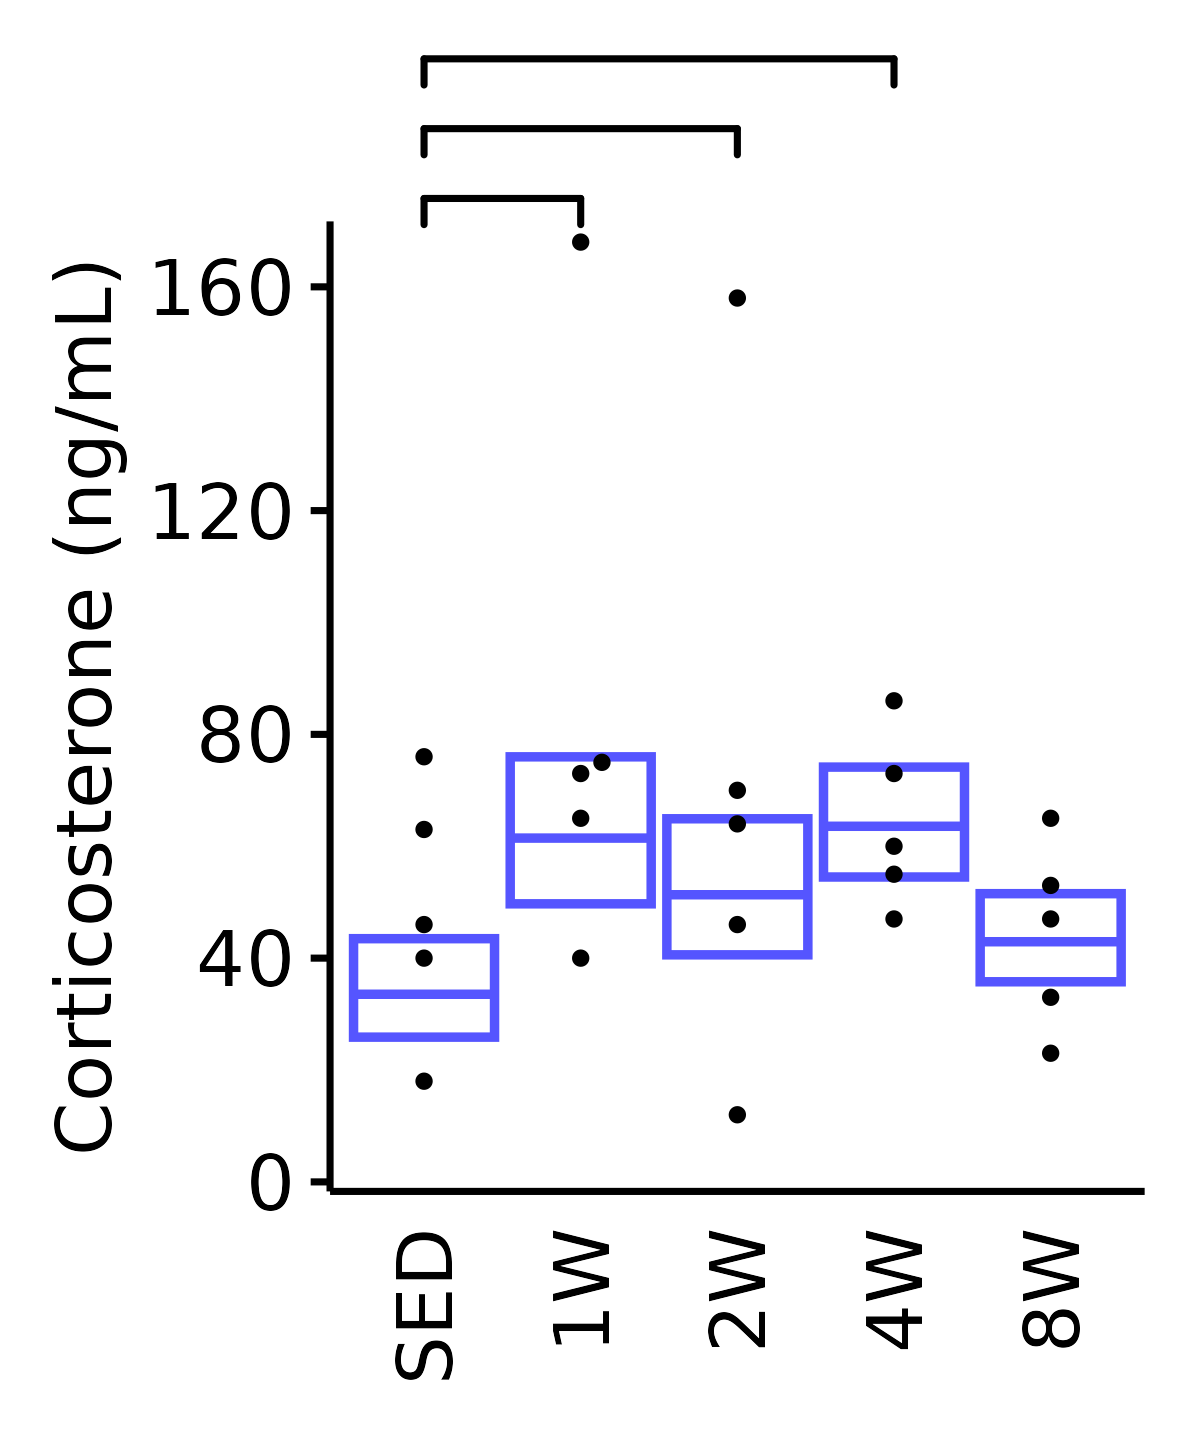
Glucagon
Glucagon (pM).
6M Female
plot_baseline(ANALYTES,
              response = "glucagon",
              conf = filter(conf_df, response == "Glucagon"),
              stats = filter(ANALYTES_STATS, response == "Glucagon"),
              sex = "Female", age = "6M") +
  scale_y_continuous(name = "Glucagon (pM)",
                     breaks = seq(0, 160, 40),
                     expand = expansion(mult = 1e-2)) +
  coord_cartesian(ylim = c(0, 162), clip = "off") +
  theme(plot.margin = unit(c(8, 5, 5, 5), units = "pt"))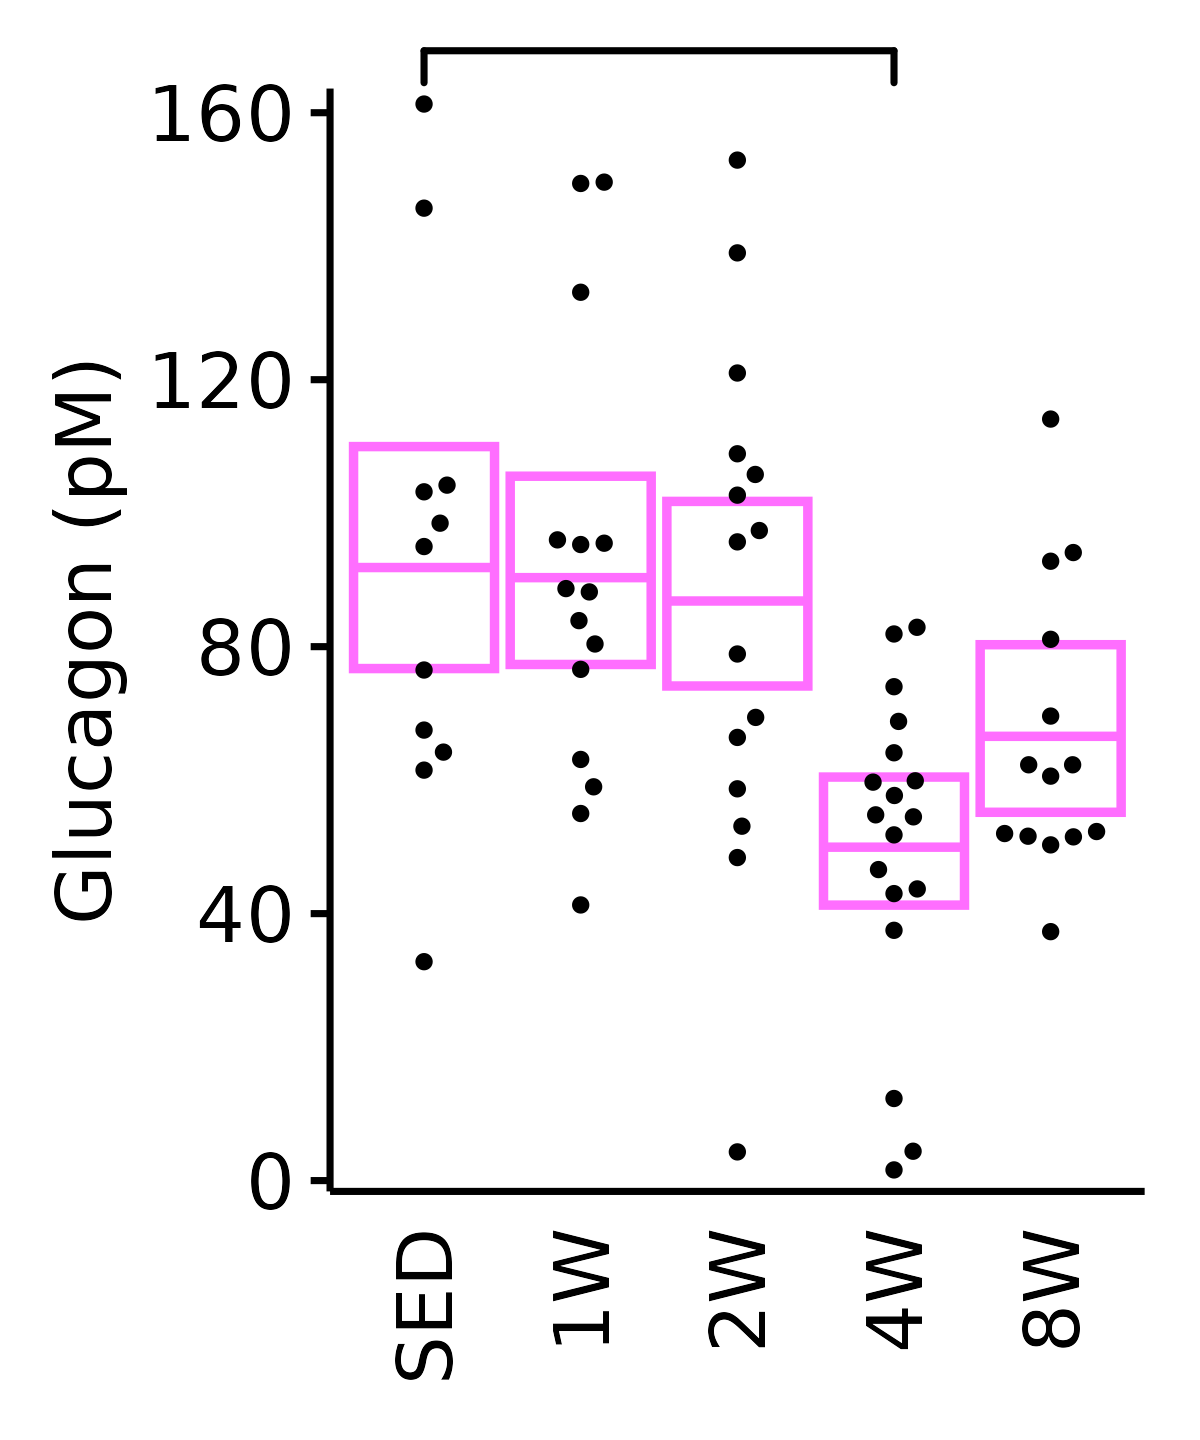
6M Male
plot_baseline(ANALYTES,
              response = "glucagon",
              conf = filter(conf_df, response == "Glucagon"),
              stats = filter(ANALYTES_STATS, response == "Glucagon"),
              sex = "Male", age = "6M") +
  scale_y_continuous(name = "Glucagon (pM)",
                     breaks = seq(0, 160, 40),
                     expand = expansion(mult = 1e-2)) +
  coord_cartesian(ylim = c(0, 162), clip = "off") +
  theme(plot.margin = unit(c(8, 5, 5, 5), units = "pt"))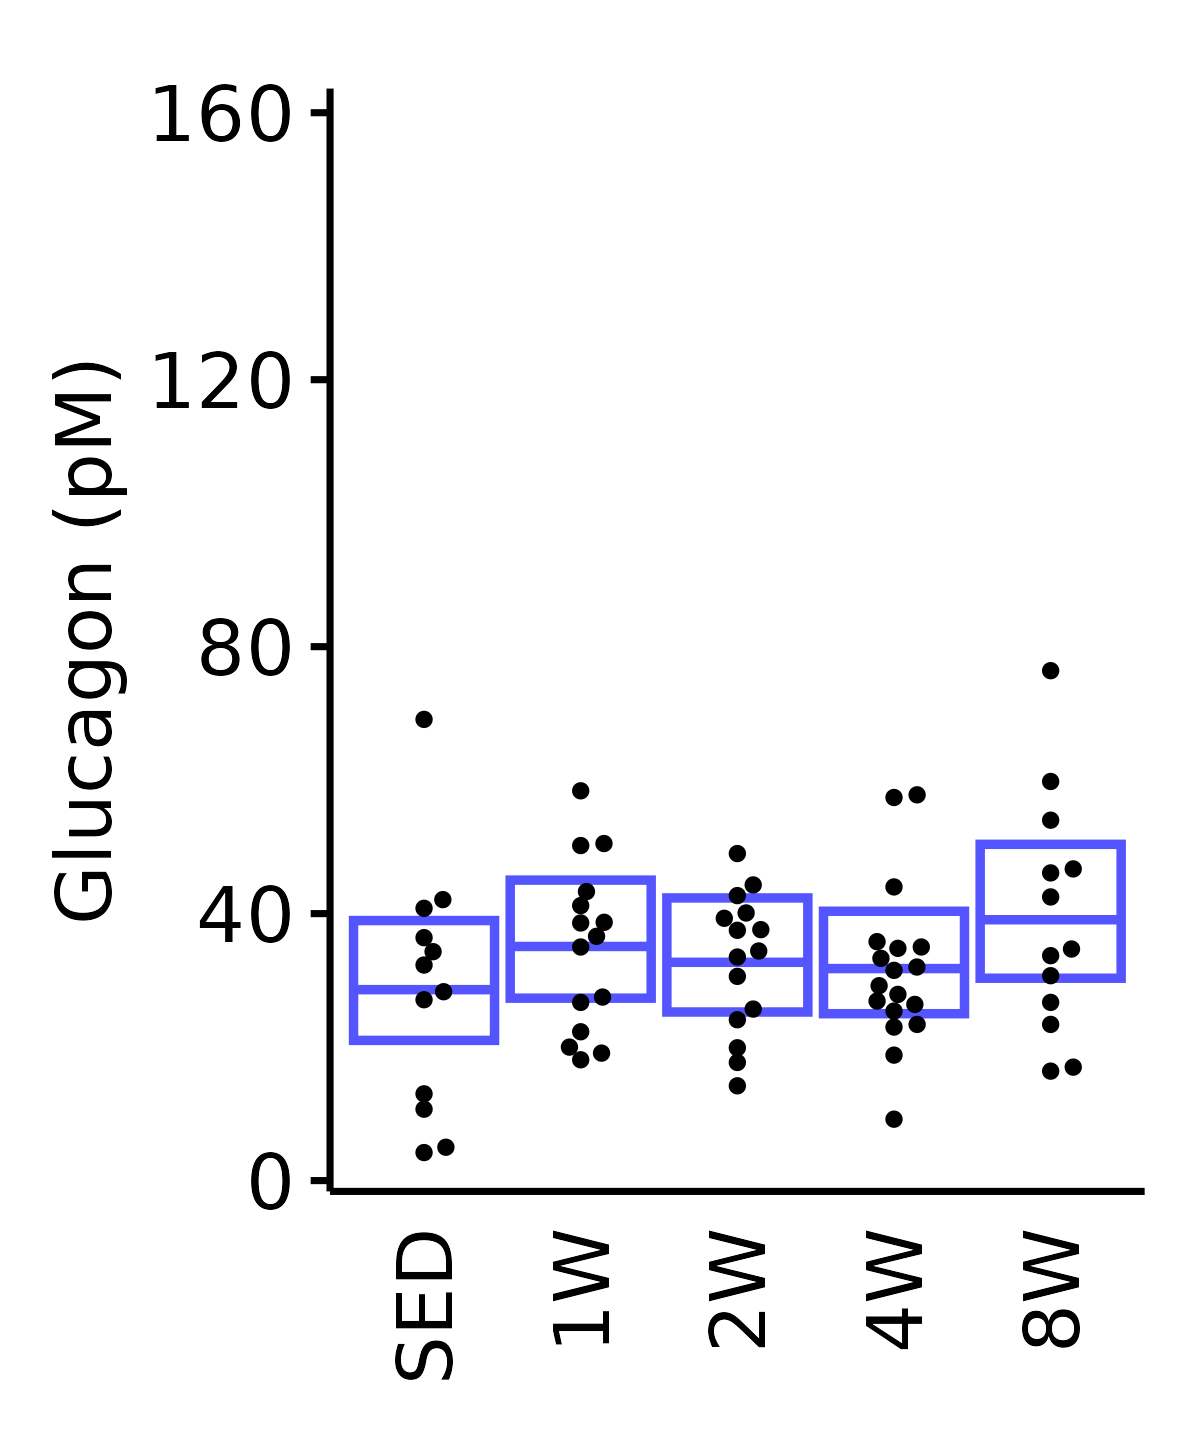
18M Female
plot_baseline(ANALYTES,
              response = "glucagon",
              conf = filter(conf_df, response == "Glucagon"),
              stats = filter(ANALYTES_STATS, response == "Glucagon"),
              sex = "Female", age = "18M") +
  scale_y_continuous(name = "Glucagon (pM)",
                     breaks = seq(0, 160, 40),
                     expand = expansion(mult = 1e-2)) +
  coord_cartesian(ylim = c(0, 162), clip = "off") +
  theme(plot.margin = unit(c(8, 5, 5, 5), units = "pt"))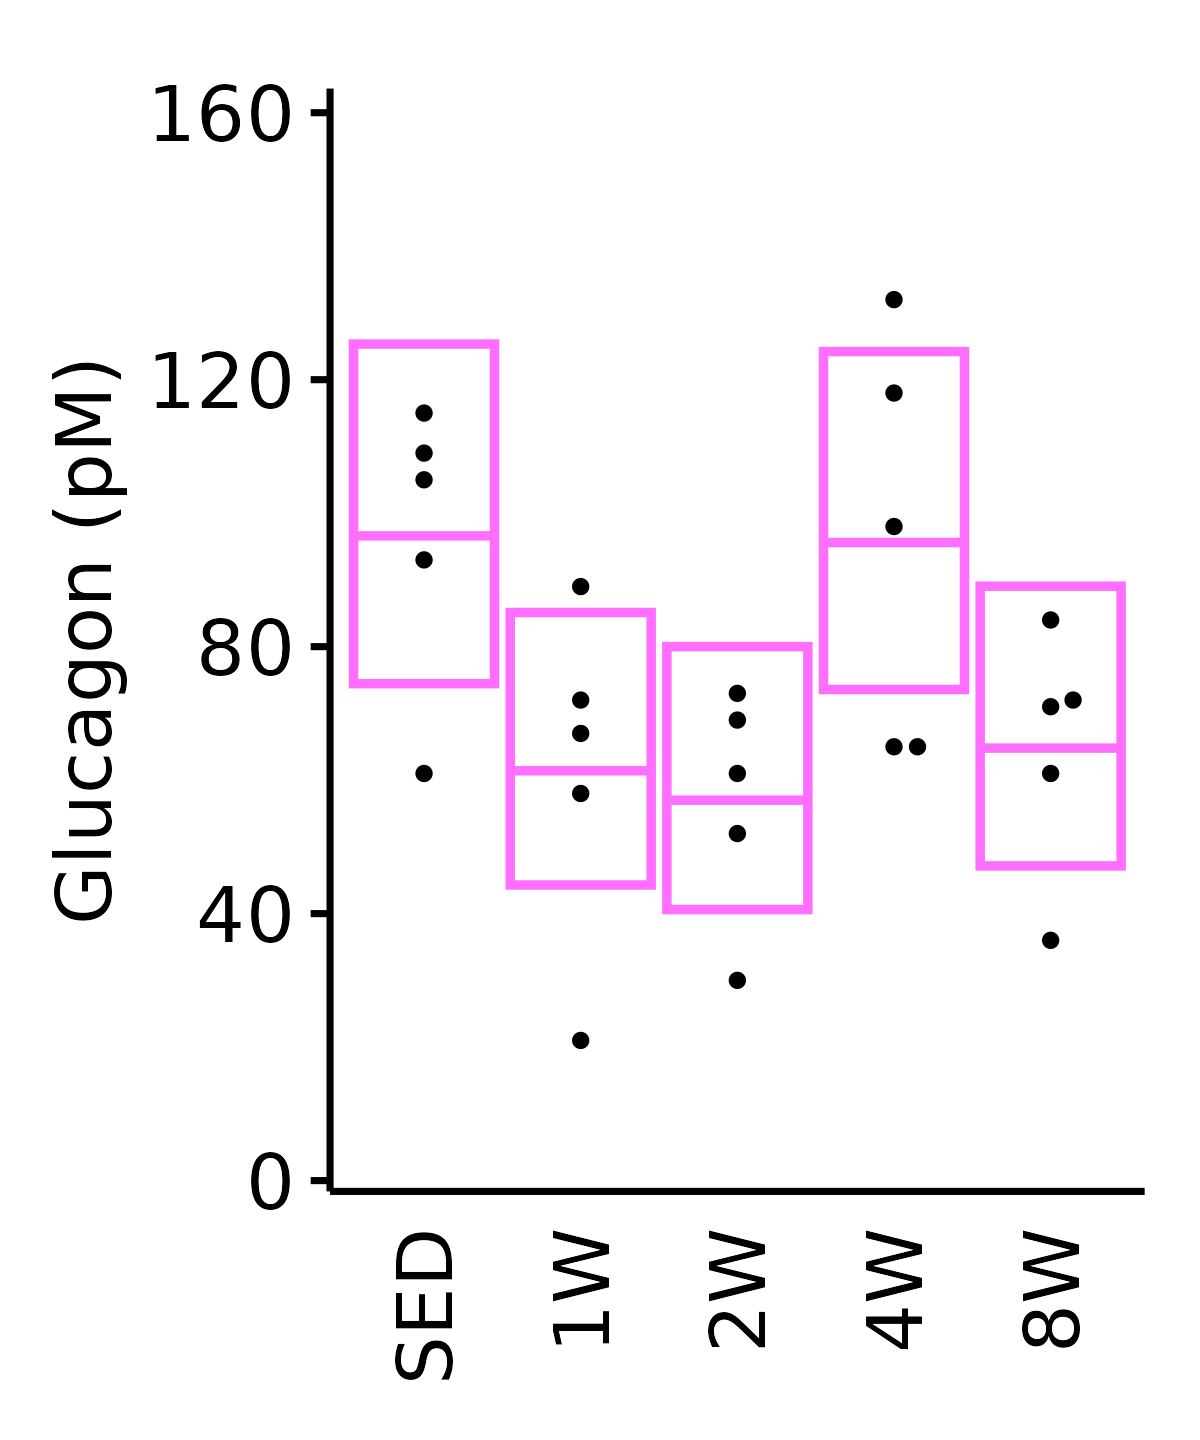
18M Male
plot_baseline(ANALYTES,
              response = "glucagon",
              conf = filter(conf_df, response == "Glucagon"),
              stats = filter(ANALYTES_STATS, response == "Glucagon"),
              sex = "Male", age = "18M") +
  scale_y_continuous(name = "Glucagon (pM)",
                     breaks = seq(0, 160, 40),
                     expand = expansion(mult = 1e-2)) +
  coord_cartesian(ylim = c(0, 162), clip = "off") +
  theme(plot.margin = unit(c(8, 5, 5, 5), units = "pt"))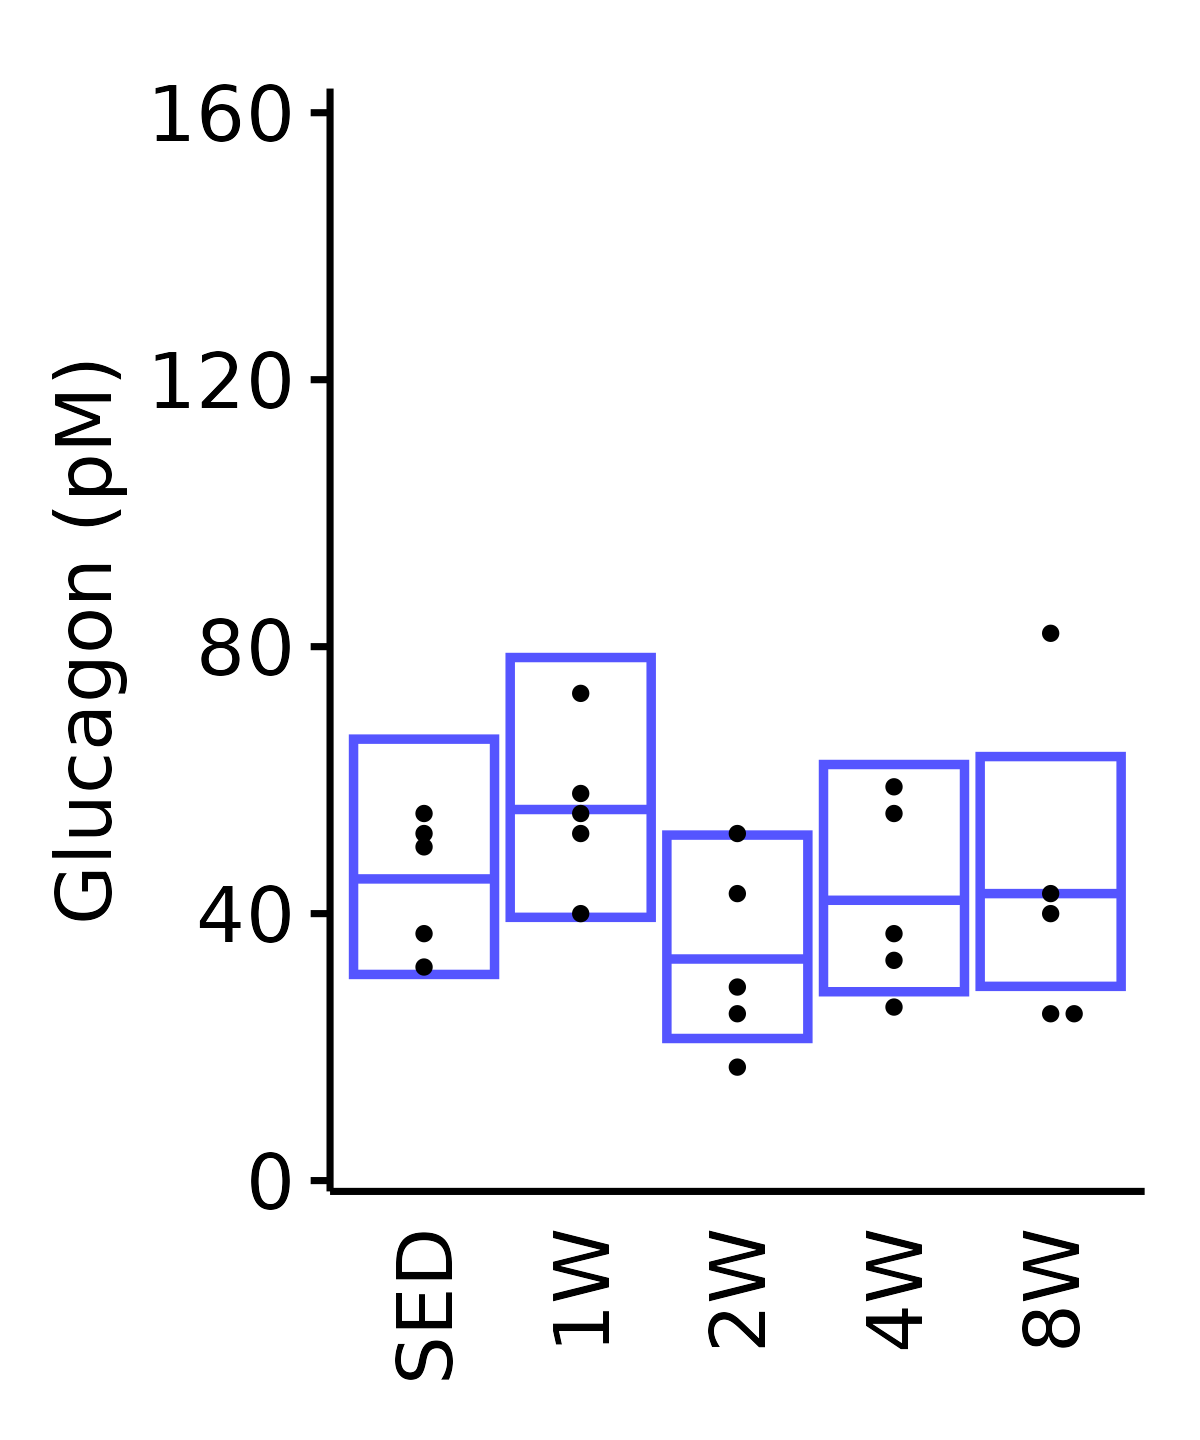
Glucose
Glucose (mg/dL).
6M Female
plot_baseline(ANALYTES,
              response = "glucose",
              conf = filter(conf_df, response == "Glucose"),
              stats = filter(ANALYTES_STATS, response == "Glucose"),
              sex = "Female", age = "6M") +
  scale_y_continuous(name = "Glucose (mg/dL)",
                     breaks = seq(110, 230, 20),
                     expand = expansion(mult = 1e-2)) +
  coord_cartesian(ylim = c(110, 230), clip = "off") +
  theme(plot.margin = unit(c(5, 5, 5, 5), units = "pt"))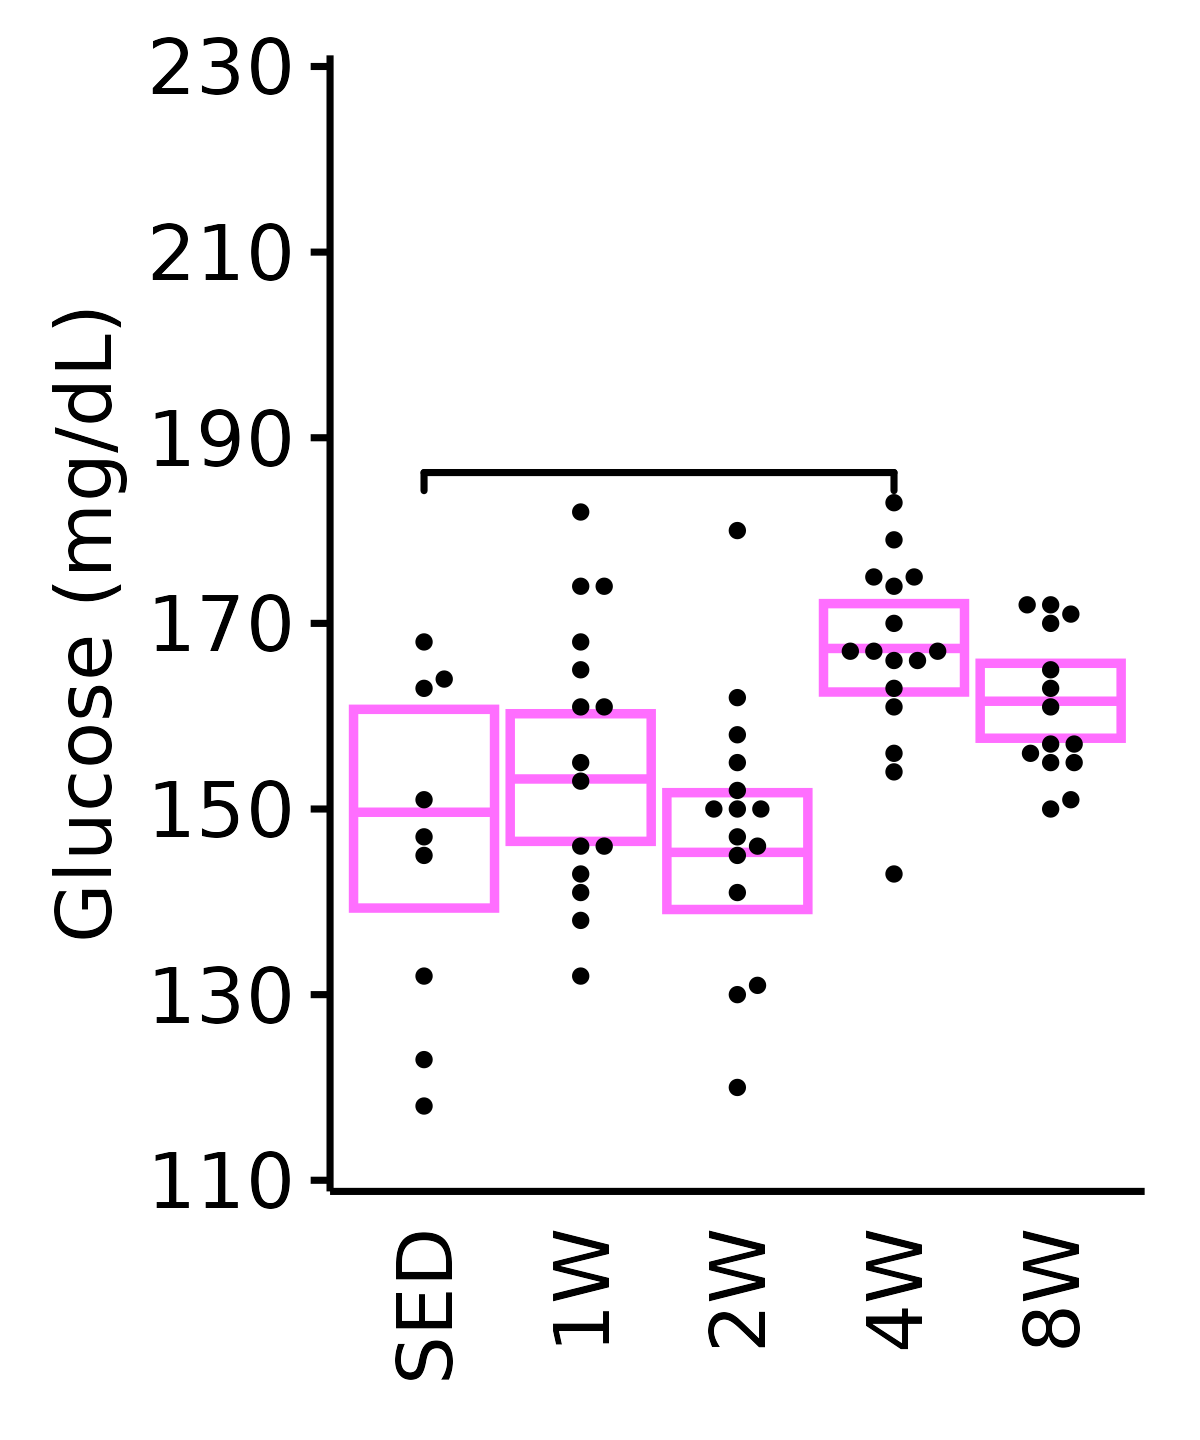
6M Male
plot_baseline(ANALYTES,
              response = "glucose",
              conf = filter(conf_df, response == "Glucose"),
              stats = filter(ANALYTES_STATS, response == "Glucose"),
              sex = "Male", age = "6M") +
  scale_y_continuous(name = "Glucose (mg/dL)",
                     breaks = seq(110, 230, 20),
                     expand = expansion(mult = 1e-2)) +
  coord_cartesian(ylim = c(110, 230), clip = "off") +
  theme(plot.margin = unit(c(5, 5, 5, 5), units = "pt"))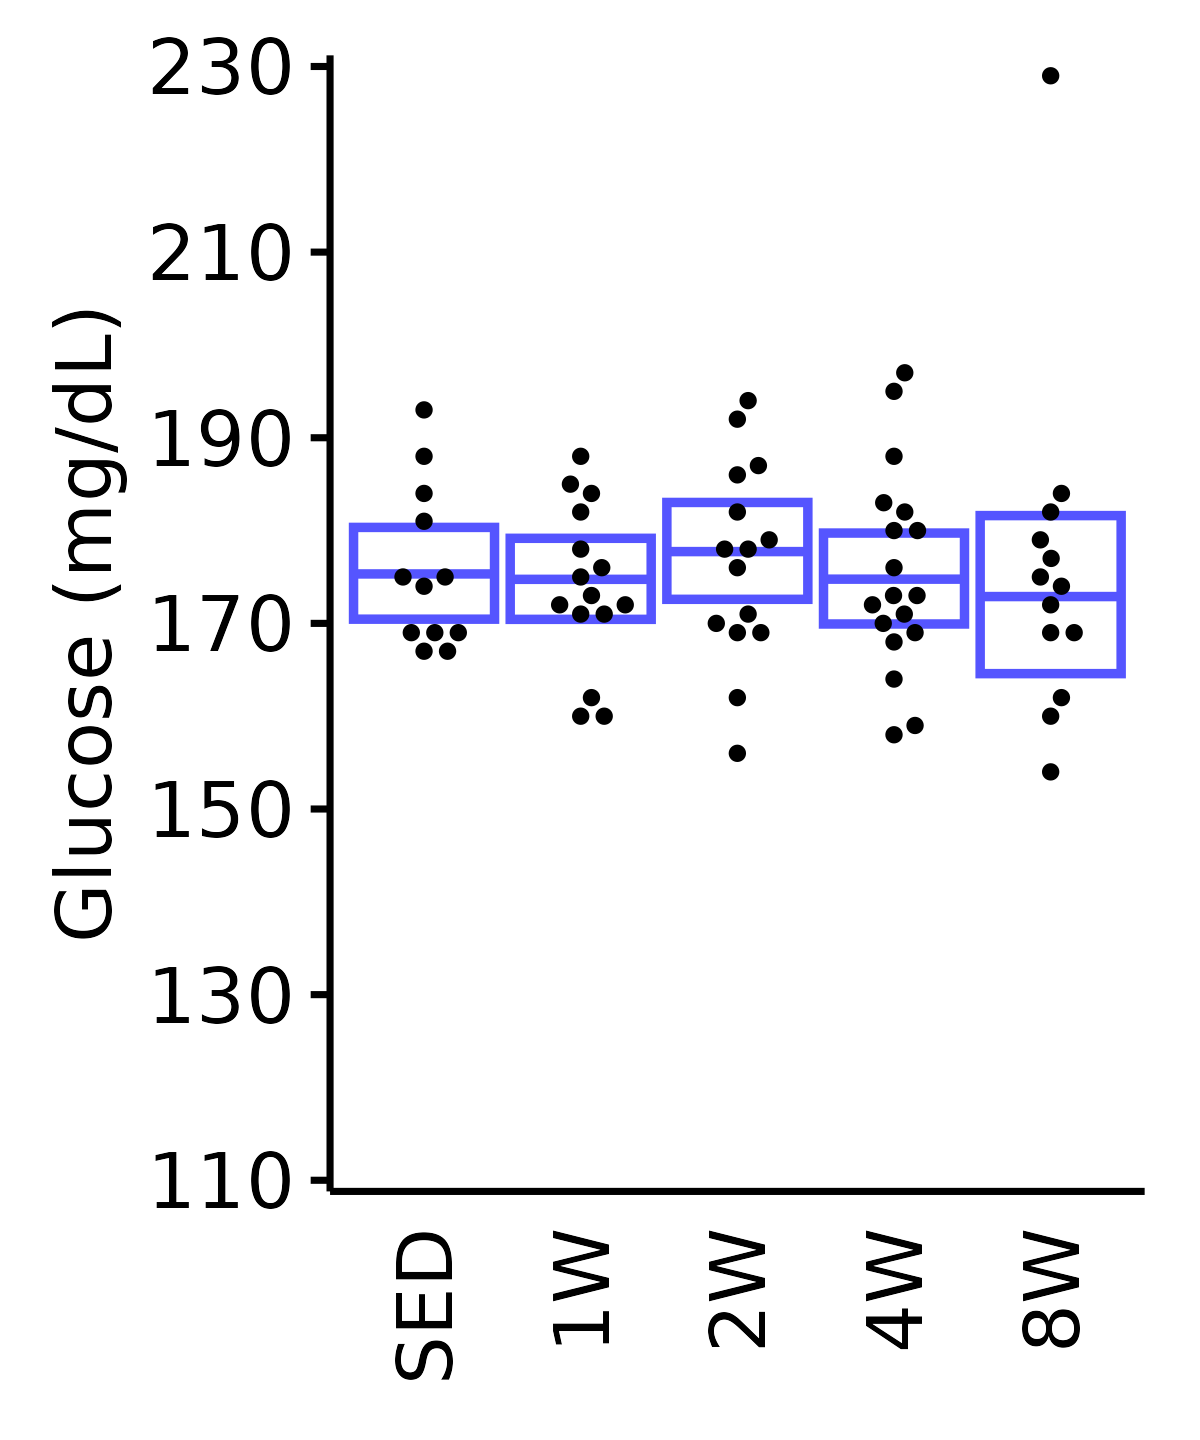
18M Female
plot_baseline(ANALYTES,
              response = "glucose",
              conf = filter(conf_df, response == "Glucose"),
              stats = filter(ANALYTES_STATS, response == "Glucose"),
              sex = "Female", age = "18M") +
  scale_y_continuous(name = "Glucose (mg/dL)",
                     breaks = seq(110, 230, 20),
                     expand = expansion(mult = 1e-2)) +
  coord_cartesian(ylim = c(110, 230), clip = "off") +
  theme(plot.margin = unit(c(5, 5, 5, 5), units = "pt"))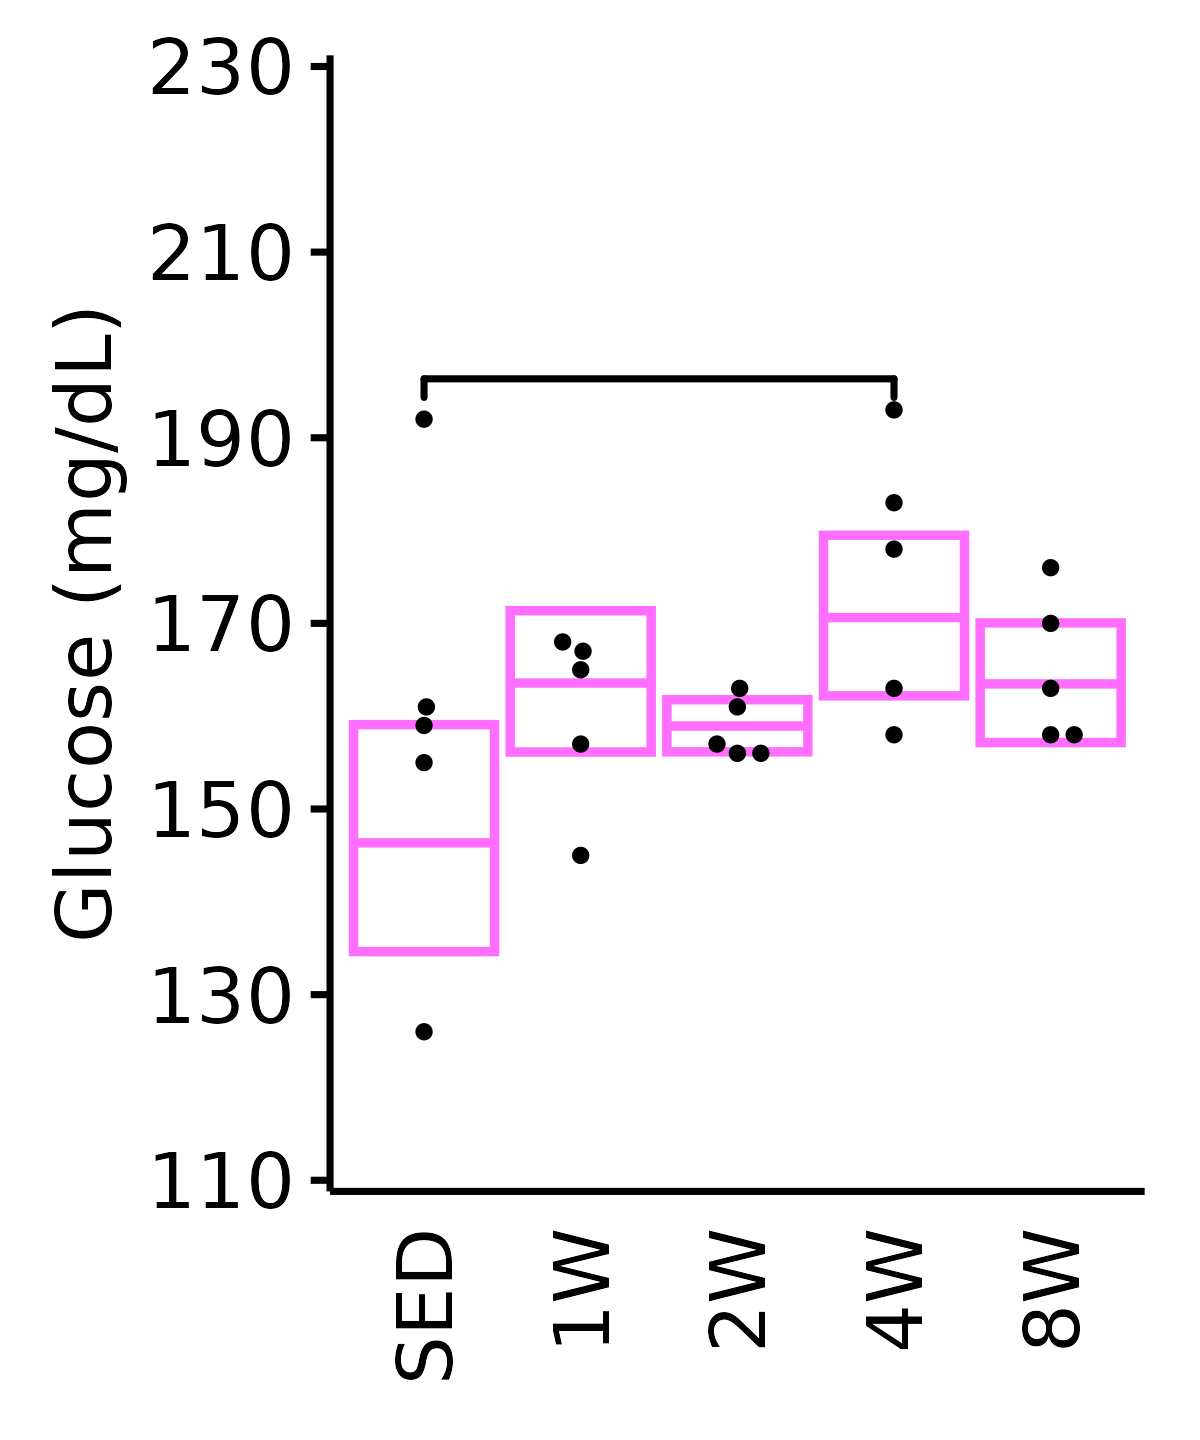
18M Male
plot_baseline(ANALYTES,
              response = "glucose",
              conf = filter(conf_df, response == "Glucose"),
              stats = filter(ANALYTES_STATS, response == "Glucose"),
              sex = "Male", age = "18M", y_position = 204) +
  scale_y_continuous(name = "Glucose (mg/dL)",
                     breaks = seq(110, 230, 20),
                     expand = expansion(mult = 1e-2)) +
  coord_cartesian(ylim = c(110, 230), clip = "off") +
  theme(plot.margin = unit(c(5, 5, 5, 5), units = "pt"))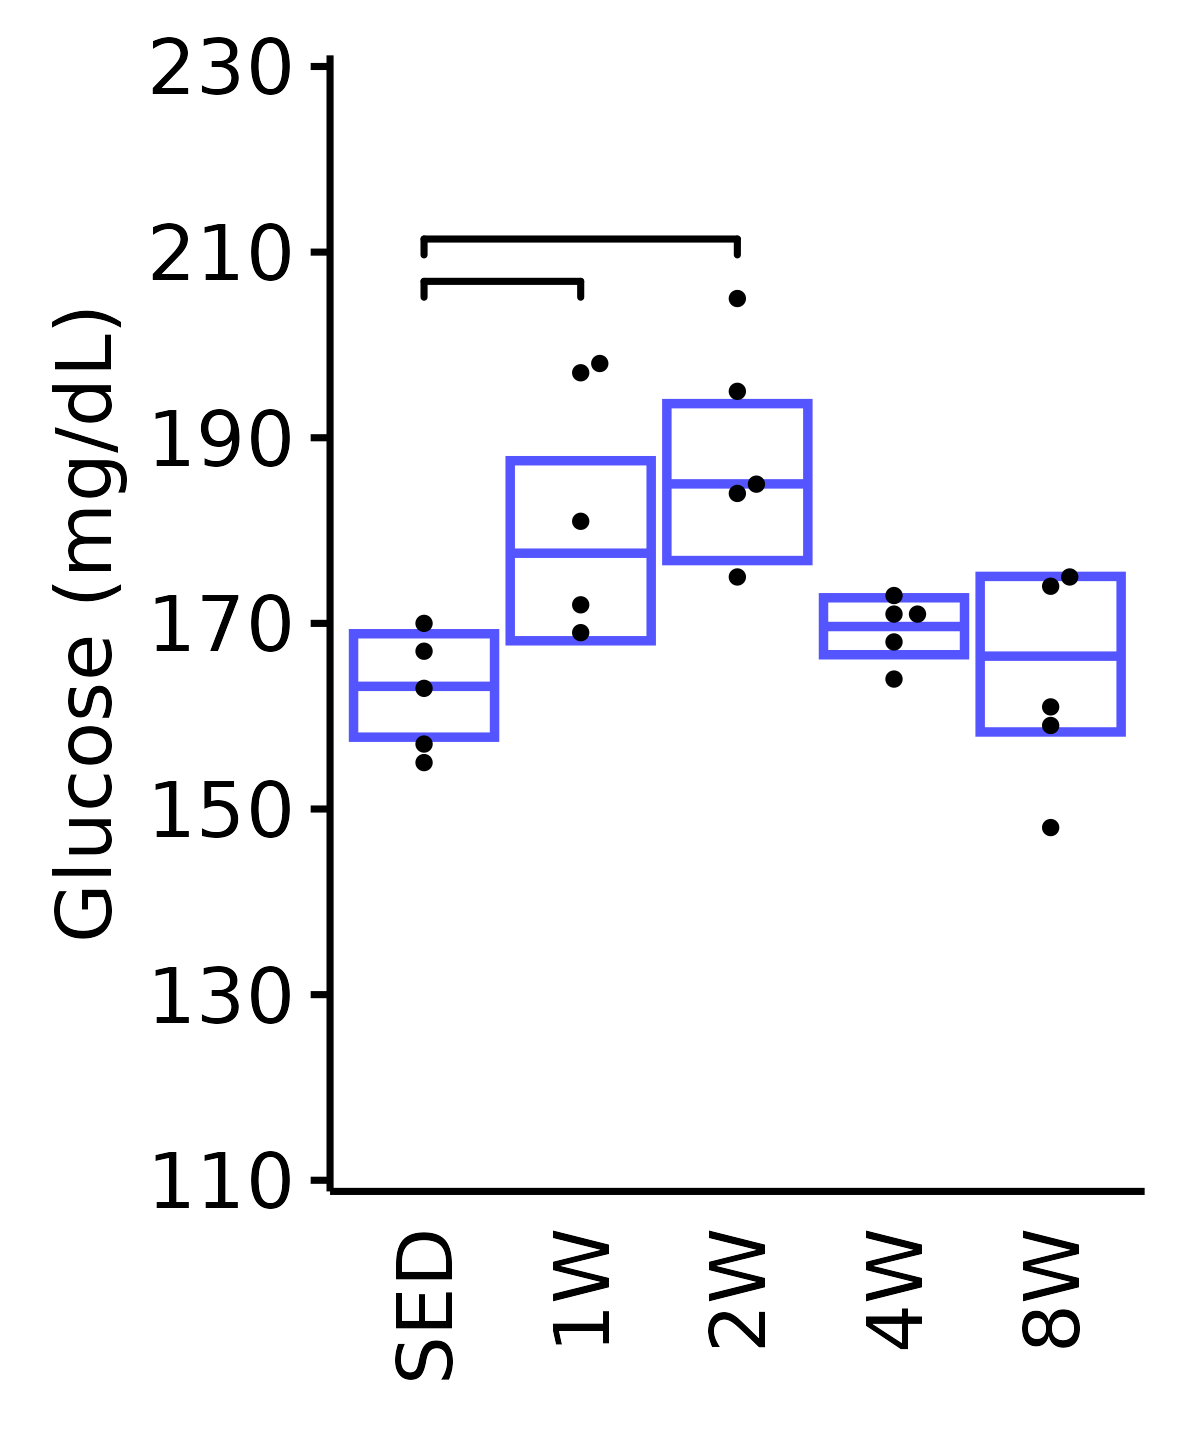
Glycerol
6M Female
plot_baseline(ANALYTES,
              response = "glycerol",
              conf = filter(conf_df, response == "Glycerol"),
              stats = filter(ANALYTES_STATS, response == "Glycerol"),
              sex = "Female", age = "6M") +
  scale_y_continuous(name = "Glycerol (mg/dL)",
                     breaks = seq(0, 2.5, 0.5),
                     expand = expansion(mult = 1e-2)) +
  coord_cartesian(ylim = c(0, 2.7), clip = "off") +
  theme(plot.margin = unit(c(10, 5, 5, 5), units = "pt"))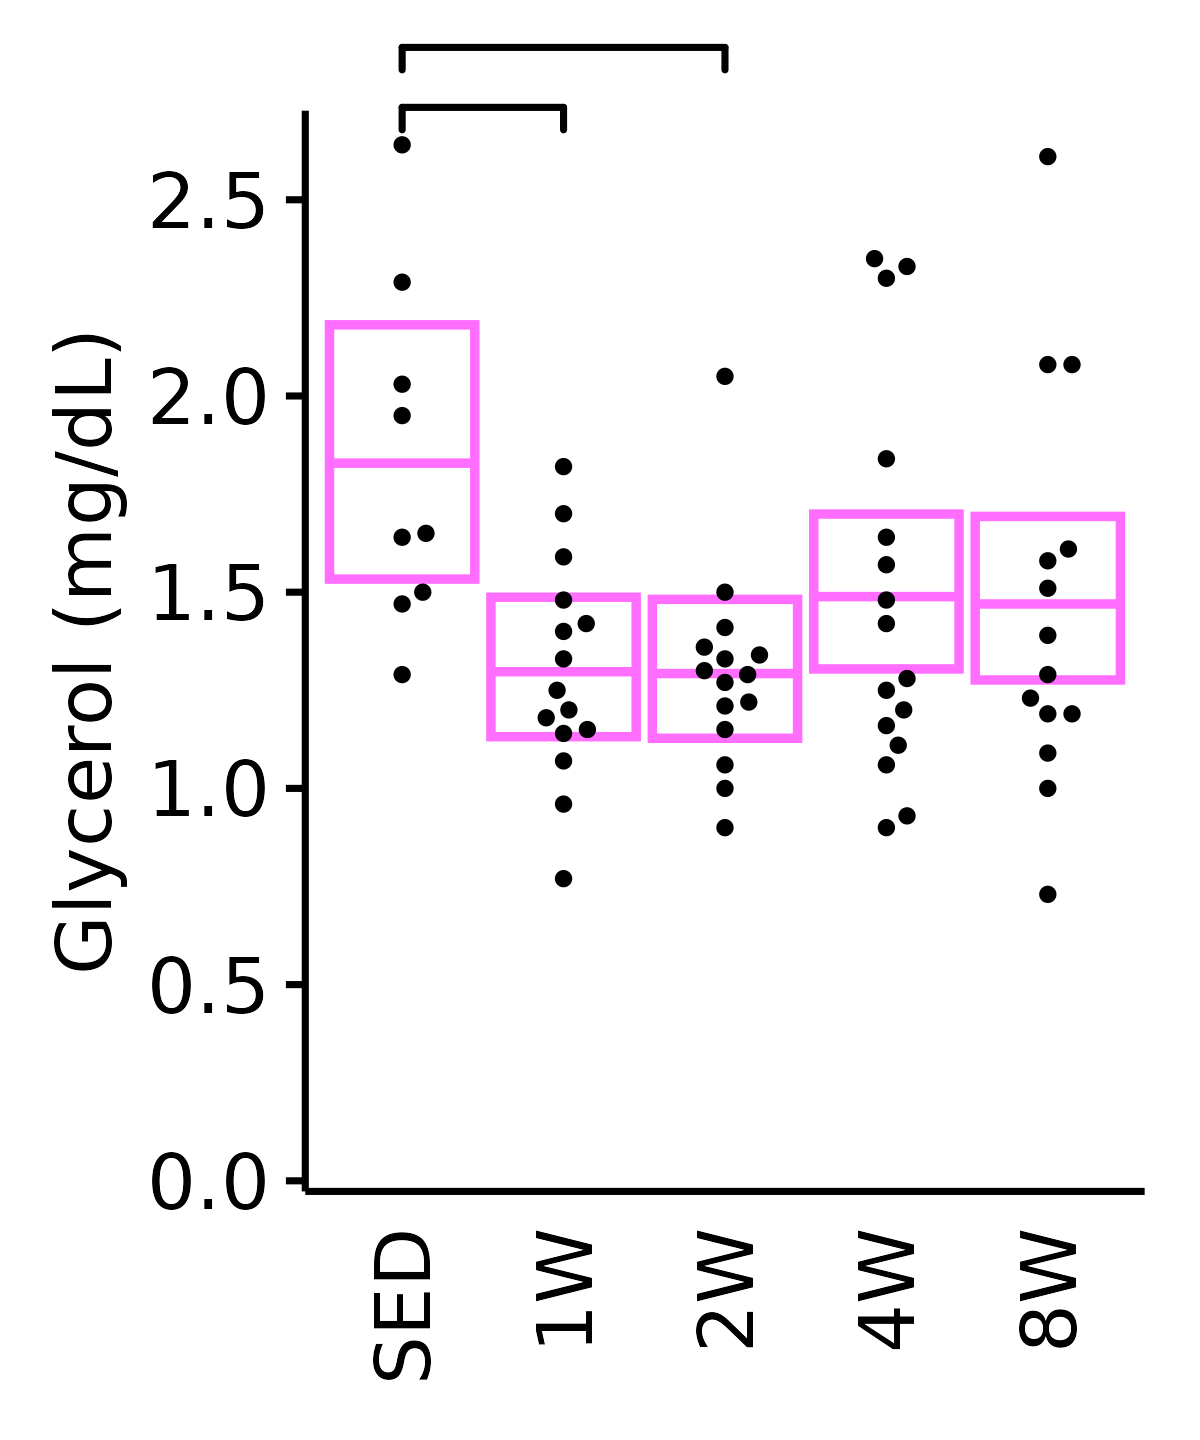
6M Male
plot_baseline(ANALYTES,
              response = "glycerol",
              conf = filter(conf_df, response == "Glycerol"),
              stats = filter(ANALYTES_STATS, response == "Glycerol"),
              sex = "Male", age = "6M") +
  scale_y_continuous(name = "Glycerol (mg/dL)",
                     breaks = seq(0, 2.5, 0.5),
                     expand = expansion(mult = 1e-2)) +
  coord_cartesian(ylim = c(0, 2.7), clip = "off") +
  theme(plot.margin = unit(c(10, 5, 5, 5), units = "pt"))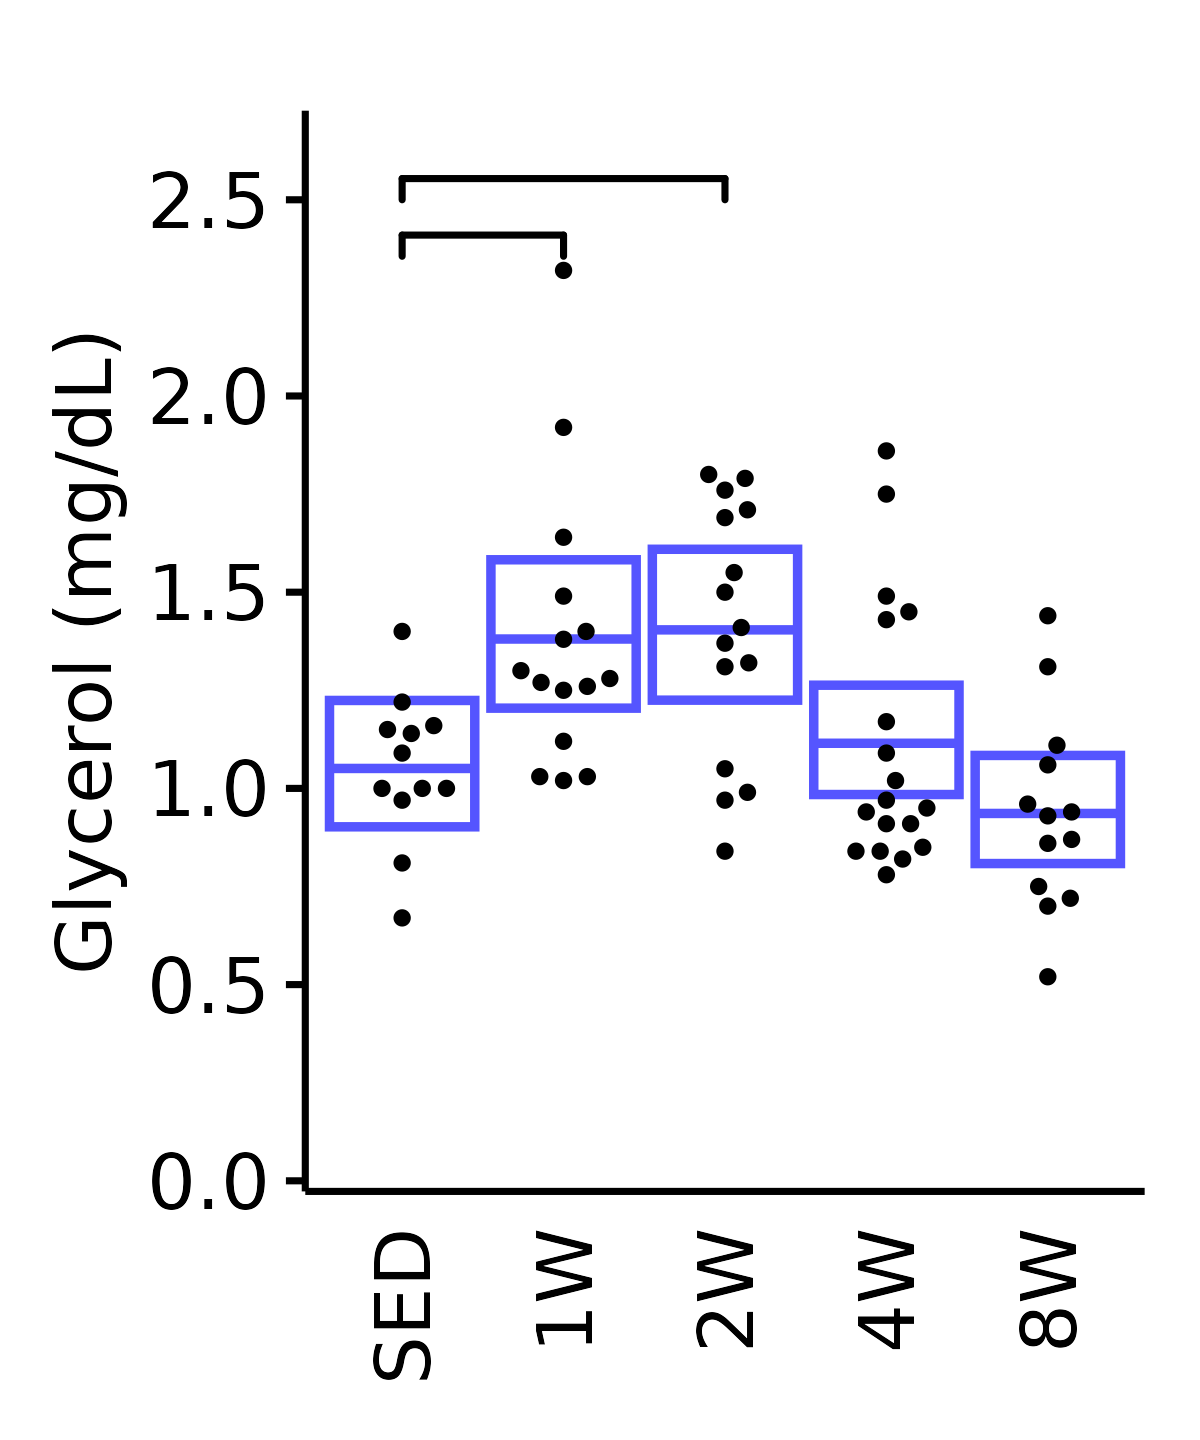
18M Female
plot_baseline(ANALYTES,
              response = "glycerol",
              conf = filter(conf_df, response == "Glycerol"),
              stats = filter(ANALYTES_STATS, response == "Glycerol"),
              sex = "Female", age = "18M") +
  scale_y_continuous(name = "Glycerol (mg/dL)",
                     breaks = seq(0, 2.5, 0.5),
                     expand = expansion(mult = 1e-2)) +
  coord_cartesian(ylim = c(0, 2.7), clip = "off") +
  theme(plot.margin = unit(c(10, 5, 5, 5), units = "pt"))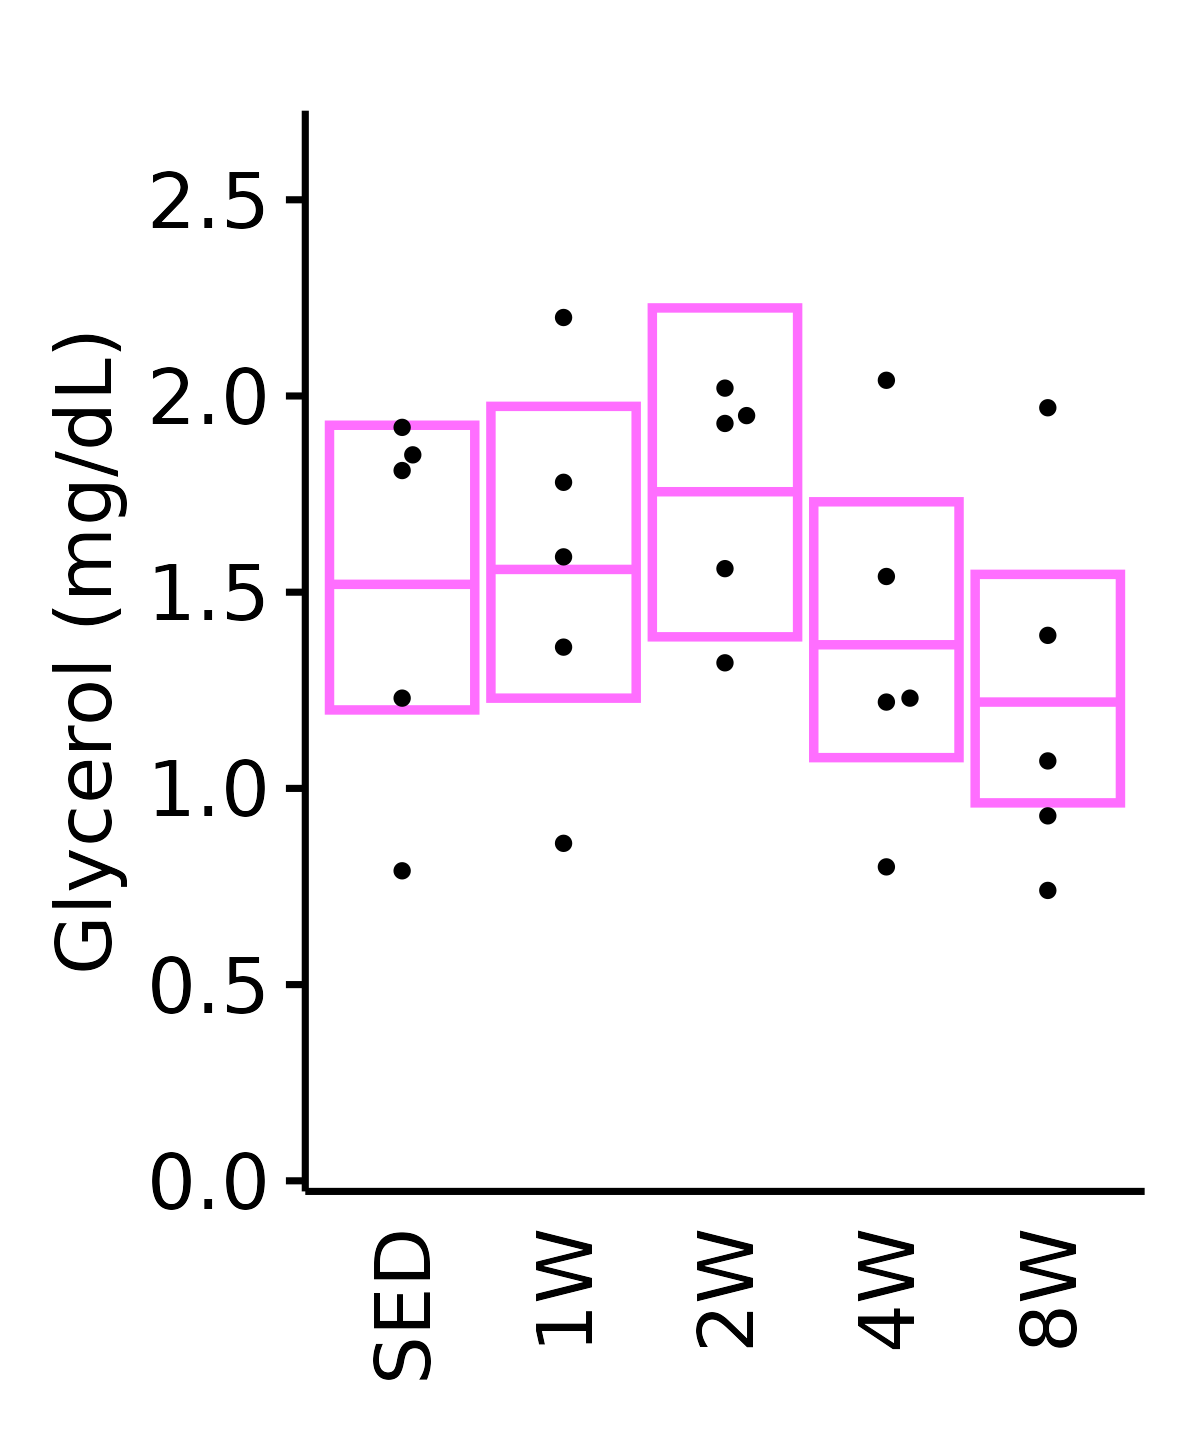
18M Male
plot_baseline(ANALYTES,
              response = "glycerol",
              conf = filter(conf_df, response == "Glycerol"),
              stats = filter(ANALYTES_STATS, response == "Glycerol"),
              sex = "Male", age = "18M") +
  scale_y_continuous(name = "Glycerol (mg/dL)",
                     breaks = seq(0, 2.5, 0.5),
                     expand = expansion(mult = 1e-2)) +
  coord_cartesian(ylim = c(0, 2.7), clip = "off") +
  theme(plot.margin = unit(c(10, 5, 5, 5), units = "pt"))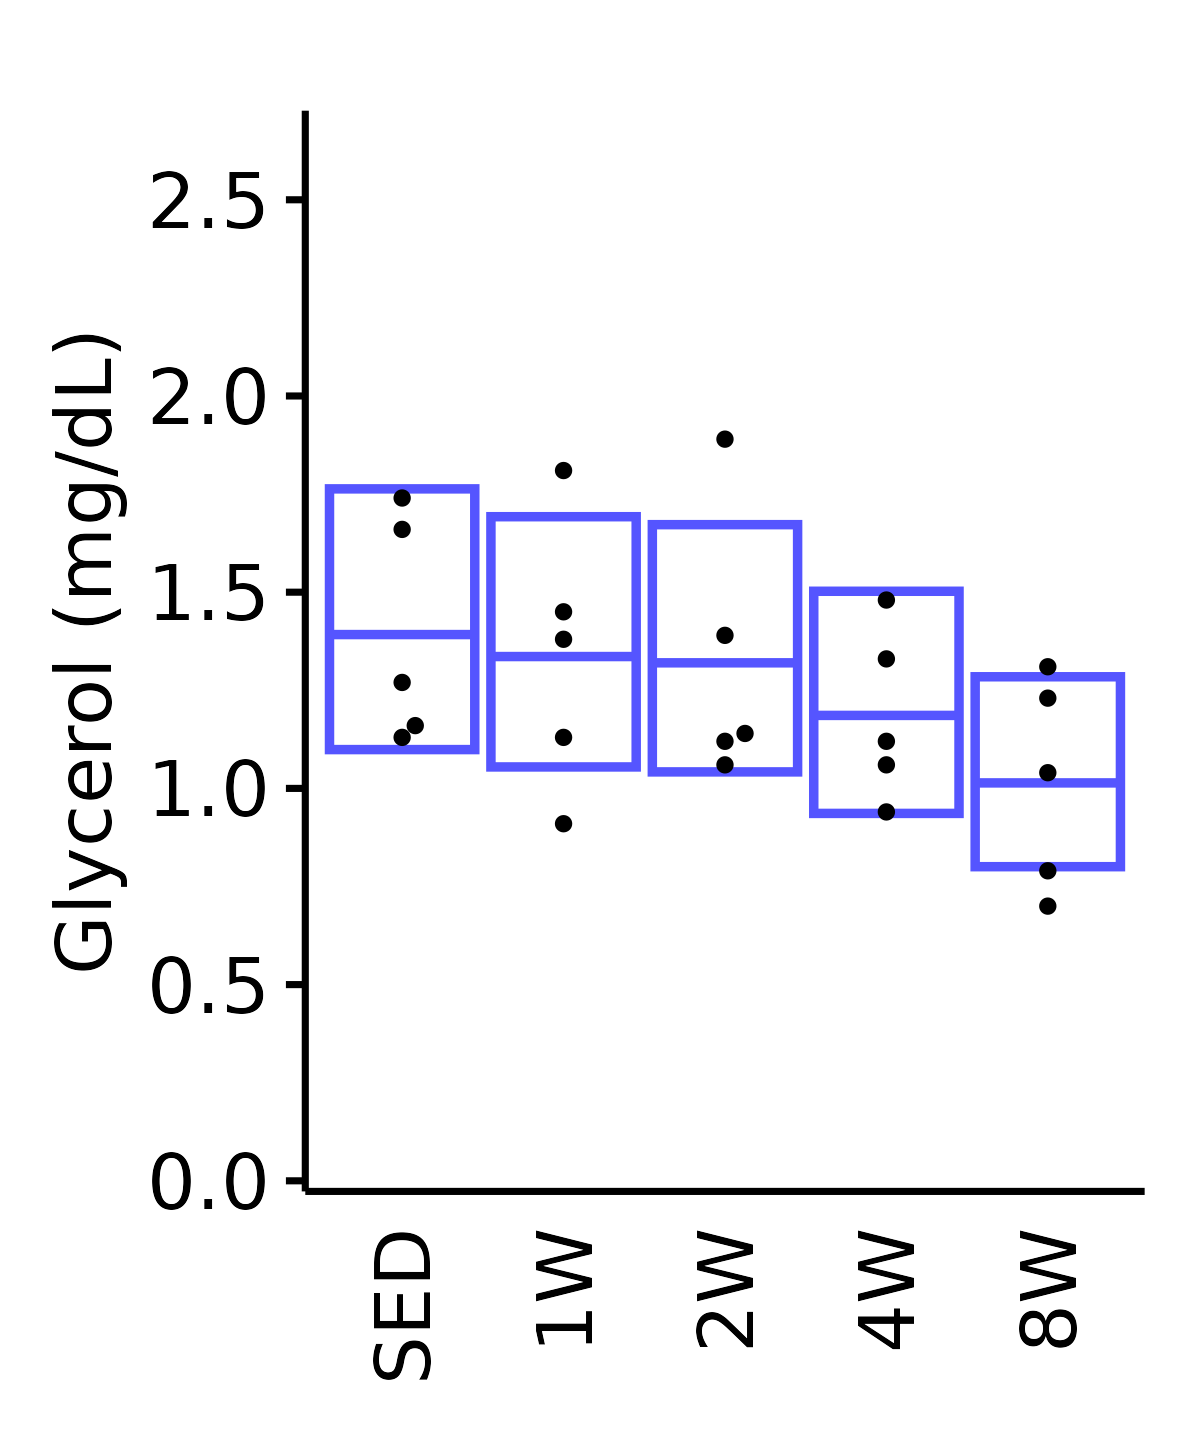
Insulin
6M Female
plot_baseline(ANALYTES,
              response = "insulin_pm",
              conf = filter(conf_df, response == "Insulin"),
              stats = filter(ANALYTES_STATS, response == "Insulin"),
              sex = "Female", age = "6M") +
  scale_y_continuous(name = "Insulin (pM)",
                     breaks = seq(0, 1400, 200),
                     expand = expansion(mult = 1e-2)) +
  coord_cartesian(ylim = c(0, 1400), clip = "off") +
  theme(plot.margin = unit(c(5, 5, 5, 5), units = "pt"))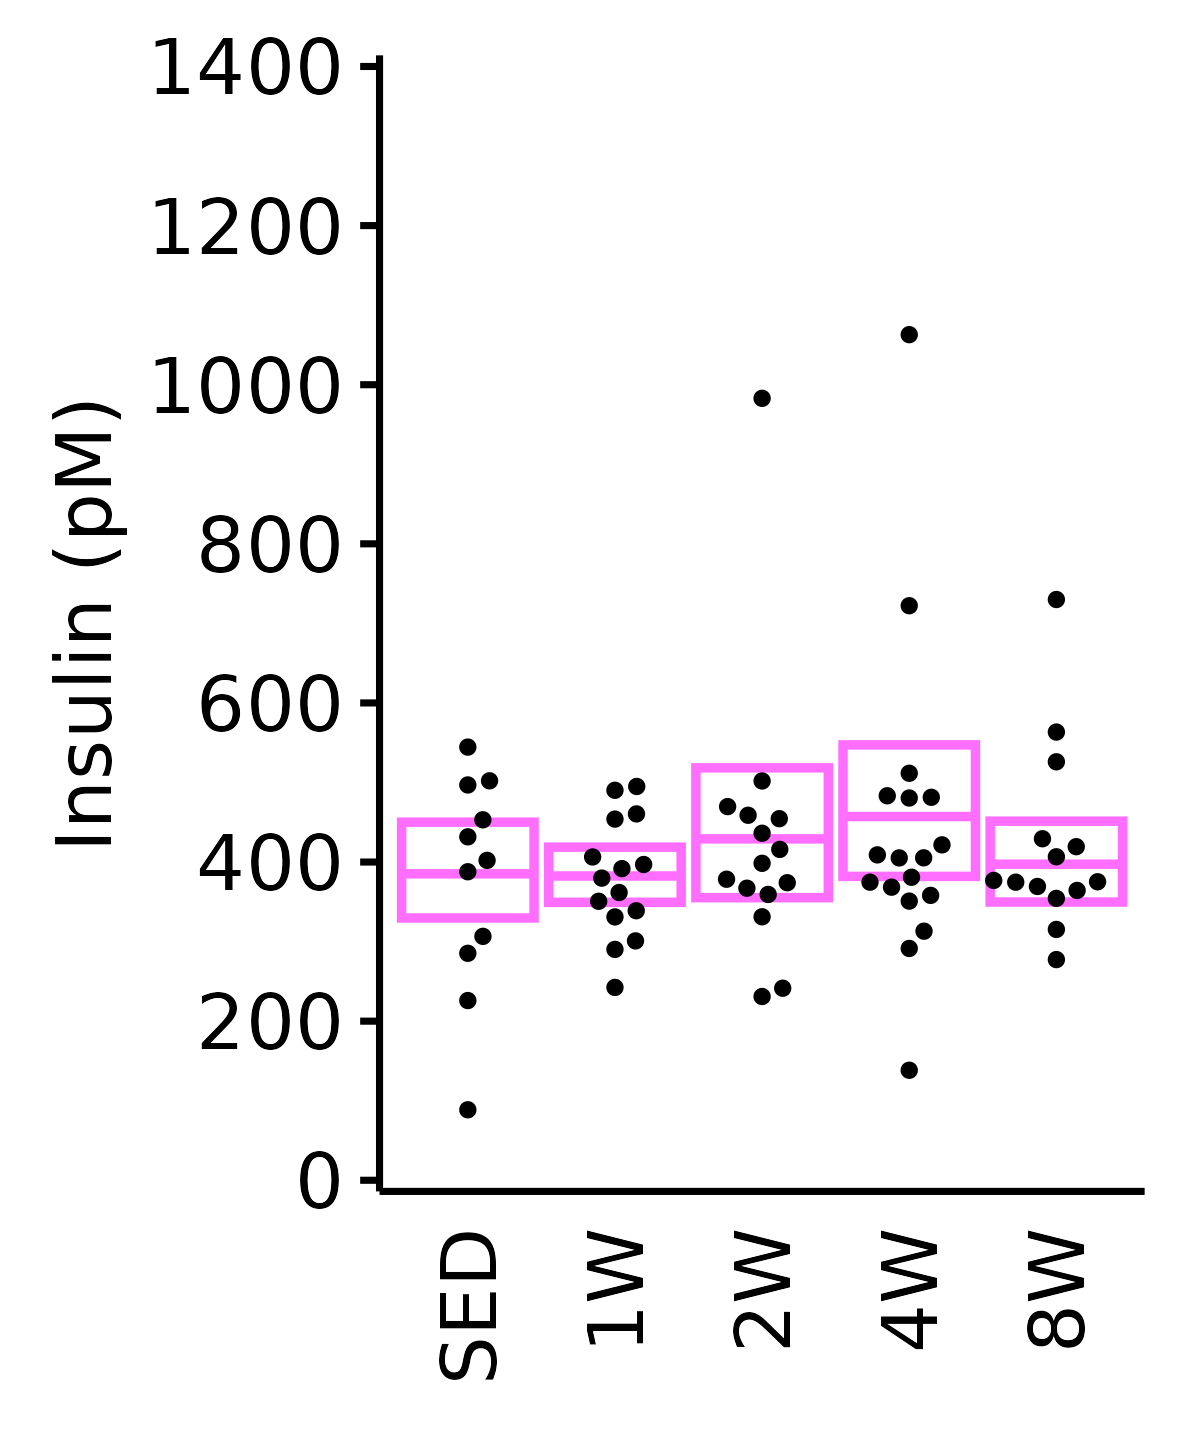
6M Male
plot_baseline(ANALYTES,
              response = "insulin_pm",
              conf = filter(conf_df, response == "Insulin"),
              stats = filter(ANALYTES_STATS, response == "Insulin"),
              sex = "Male", age = "6M", y_position = 970) +
  scale_y_continuous(name = "Insulin (pM)",
                     breaks = seq(0, 1400, 200),
                     expand = expansion(mult = 1e-2)) +
  coord_cartesian(ylim = c(0, 1400), clip = "off") +
  theme(plot.margin = unit(c(5, 5, 5, 5), units = "pt"))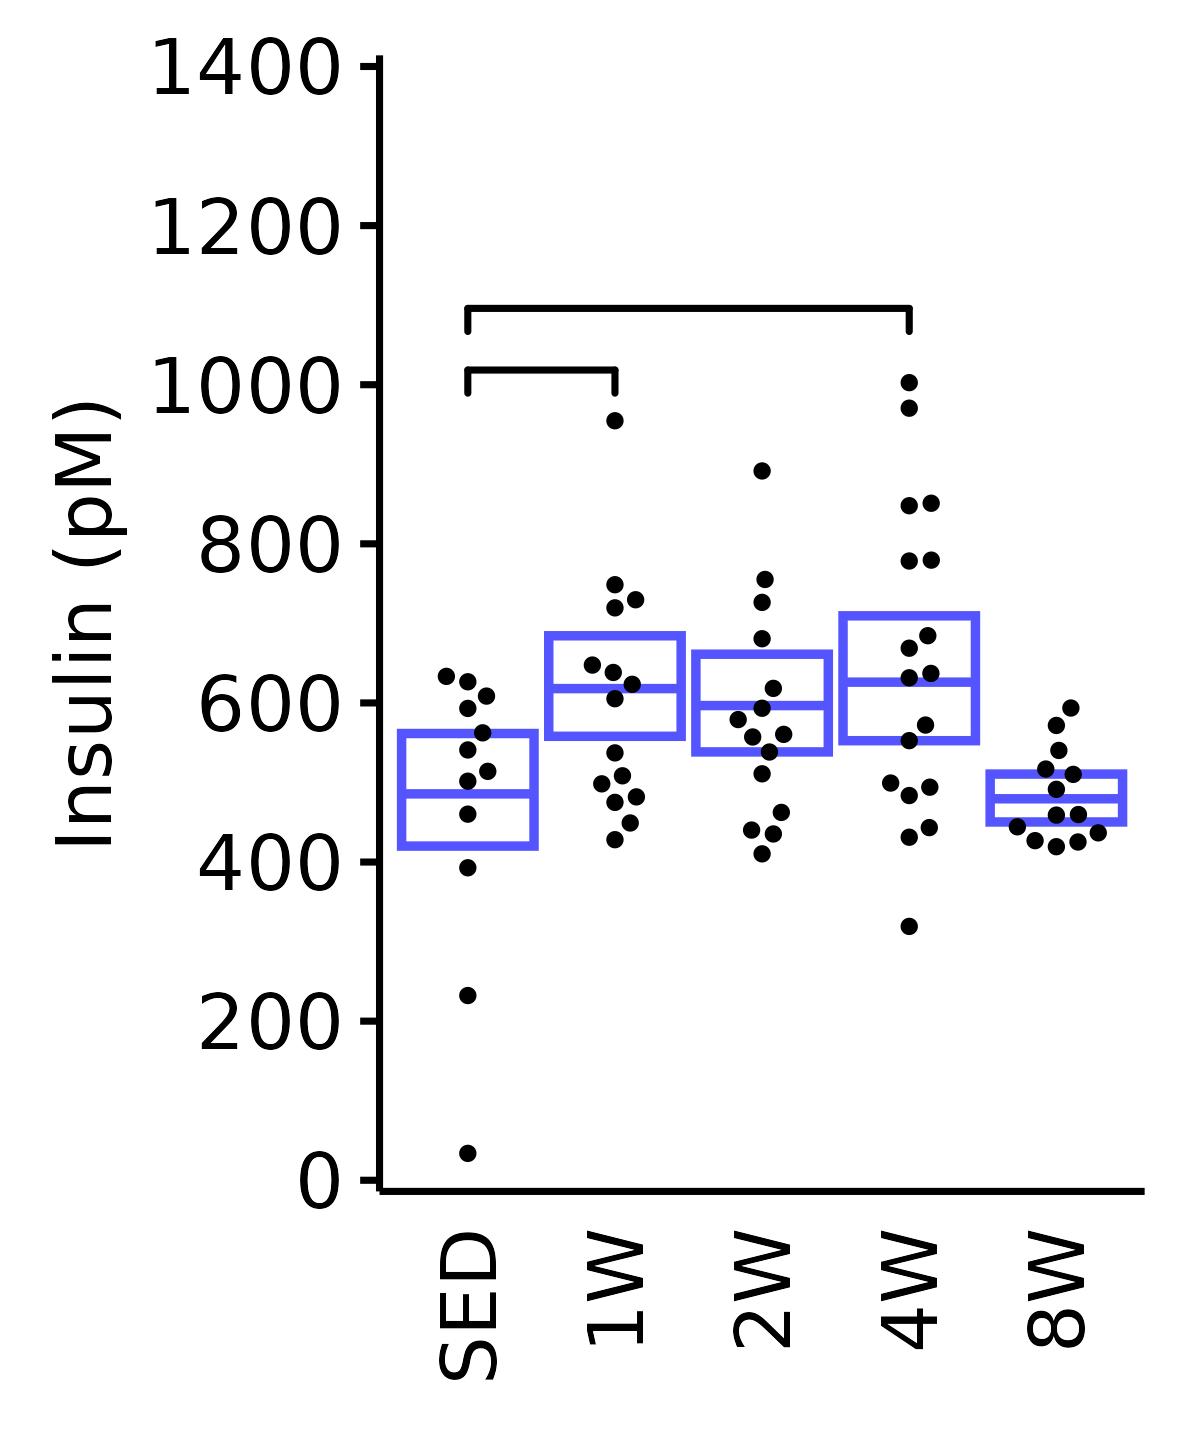
18M Female
plot_baseline(ANALYTES,
              response = "insulin_pm",
              conf = filter(conf_df, response == "Insulin"),
              stats = filter(ANALYTES_STATS, response == "Insulin"),
              sex = "Female", age = "18M") +
  scale_y_continuous(name = "Insulin (pM)",
                     breaks = seq(0, 1400, 200),
                     expand = expansion(mult = 1e-2)) +
  coord_cartesian(ylim = c(0, 1400), clip = "off") +
  theme(plot.margin = unit(c(5, 5, 5, 5), units = "pt"))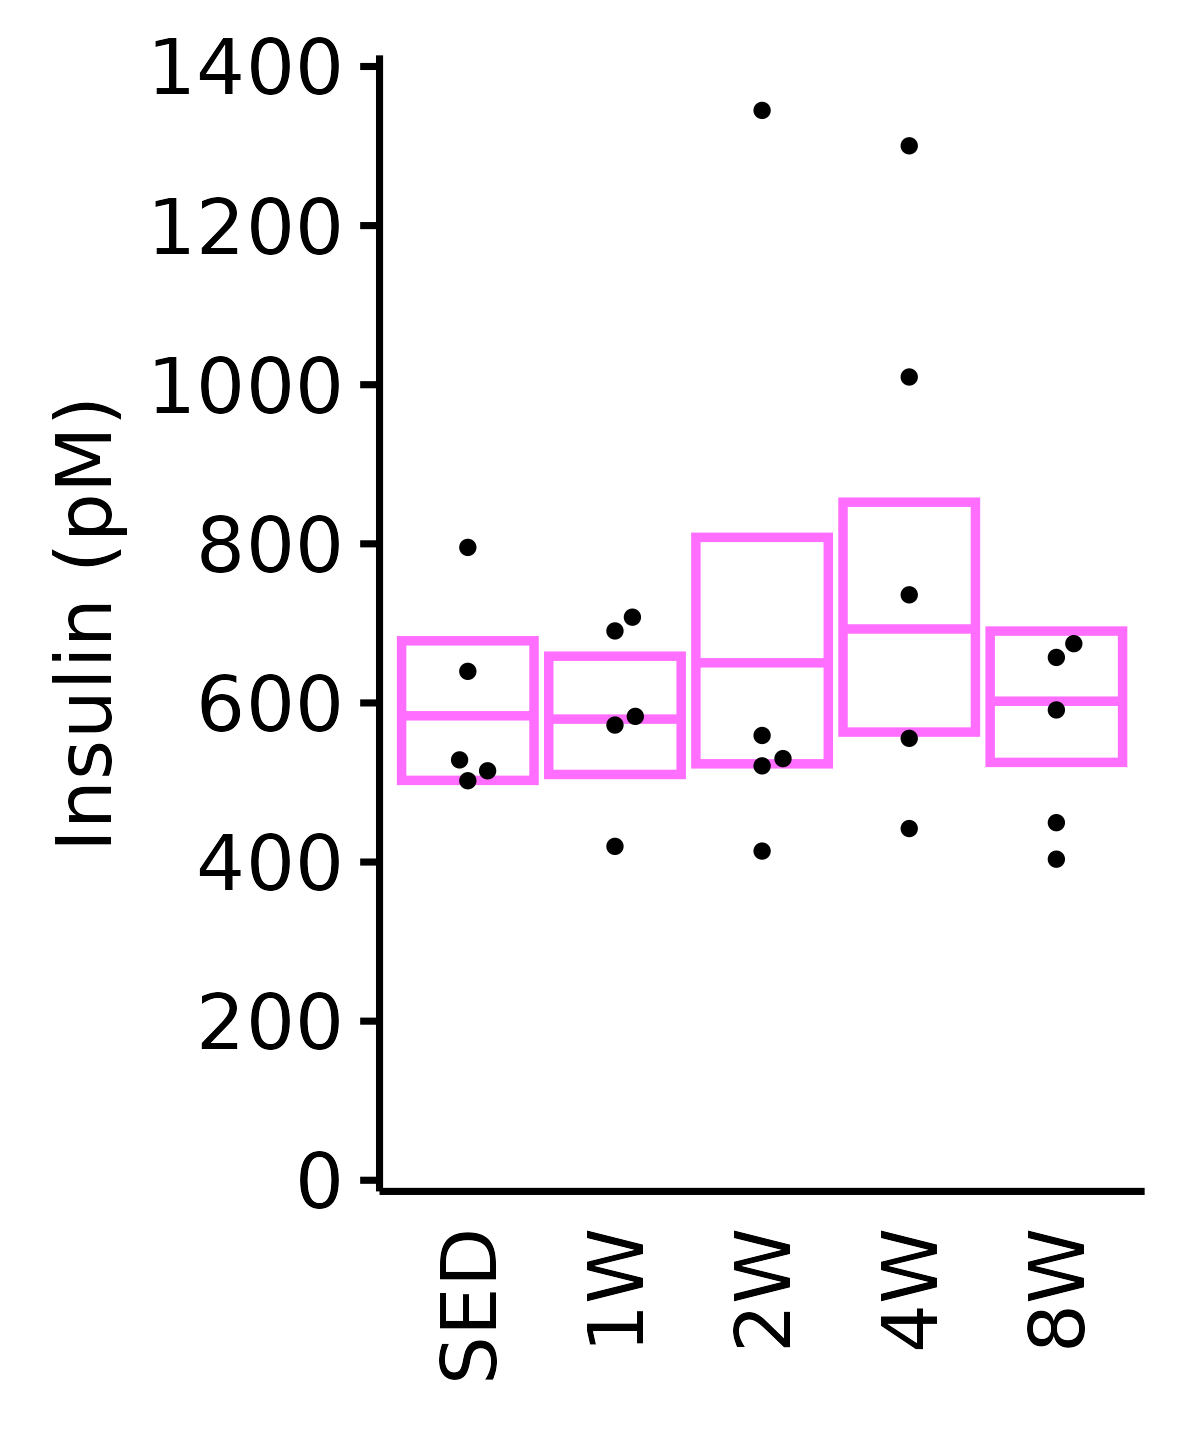
18M Male
plot_baseline(ANALYTES,
              response = "insulin_pm",
              conf = filter(conf_df, response == "Insulin"),
              stats = filter(ANALYTES_STATS, response == "Insulin"),
              sex = "Male", age = "18M", y_position = 940) +
  scale_y_continuous(name = "Insulin (pM)",
                     breaks = seq(0, 1400, 200),
                     expand = expansion(mult = 1e-2)) +
  coord_cartesian(ylim = c(0, 1400), clip = "off") +
  theme(plot.margin = unit(c(5, 5, 5, 5), units = "pt"))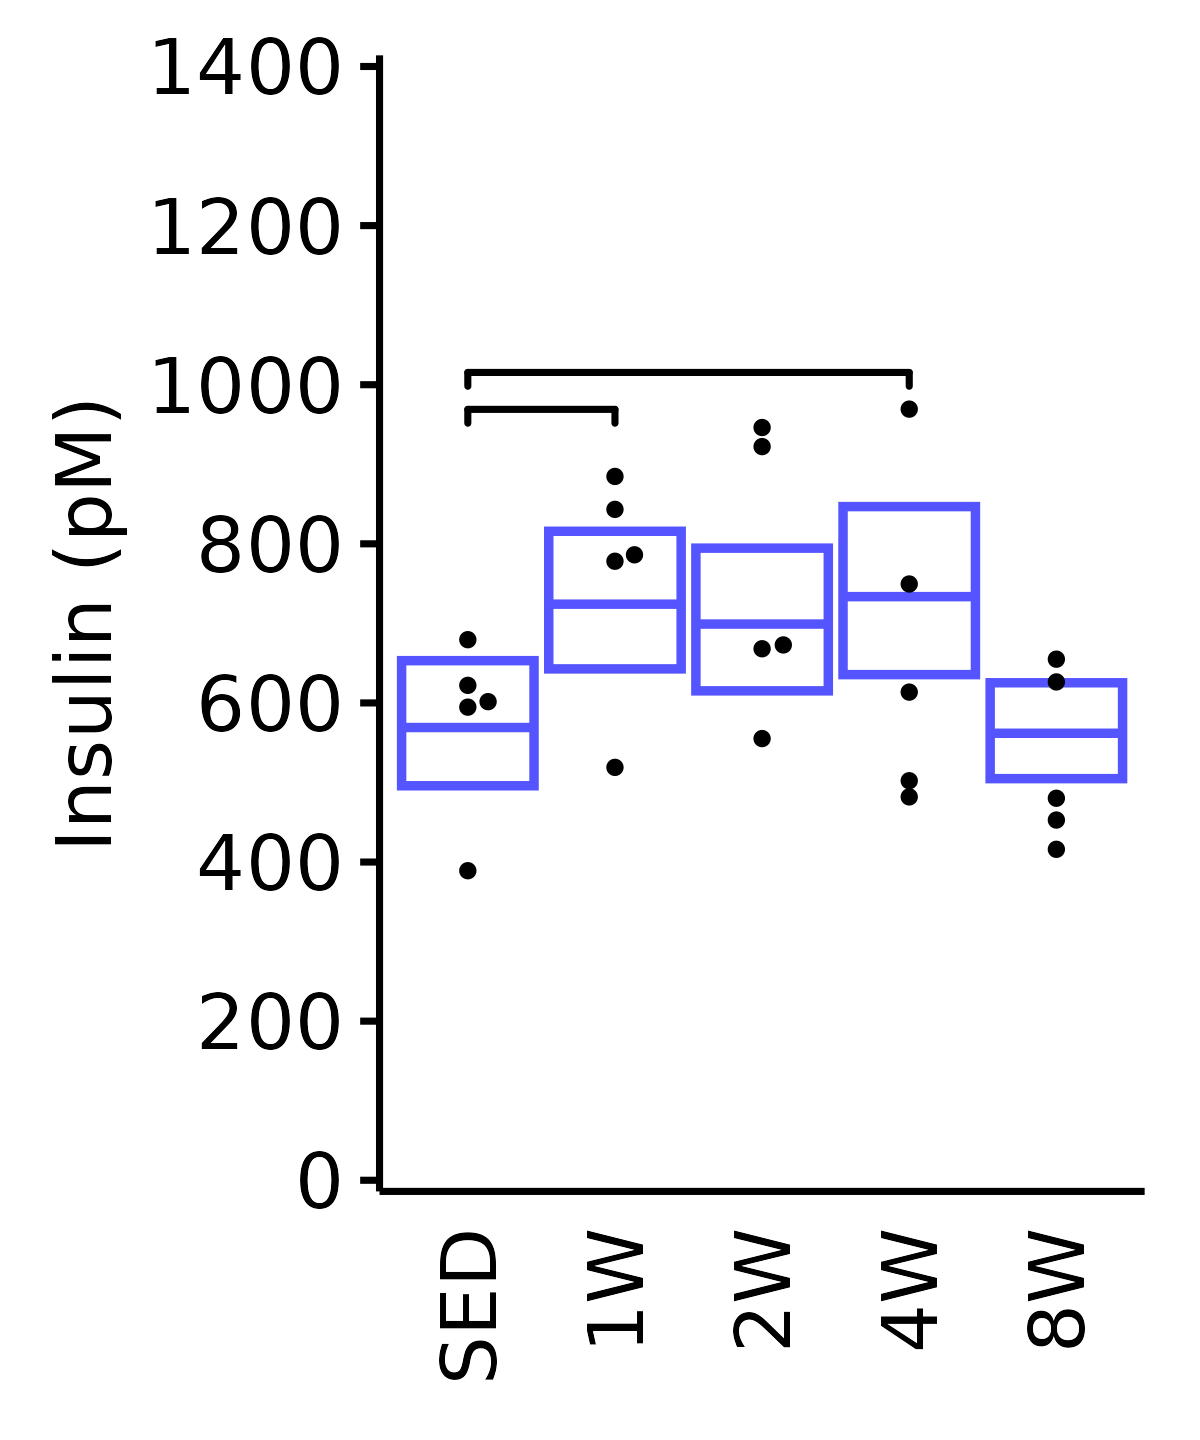
Ketones
Ketones (\(\mu\)mol/L).
6M Female
plot_baseline(ANALYTES,
              response = "ketones",
              conf = filter(conf_df, response == "Ketones"),
              stats = filter(ANALYTES_STATS, response == "Ketones"),
              sex = "Female", age = "6M") +
  scale_y_continuous(name = TeX("Ketones ($\\mu$mol/L)"),
                     breaks = seq(0, 1400, 200),
                     expand = expansion(mult = 1e-2)) +
  coord_cartesian(ylim = c(0, 1450), clip = "off") +
  theme(plot.margin = unit(c(5, 5, 5, 5), units = "pt"))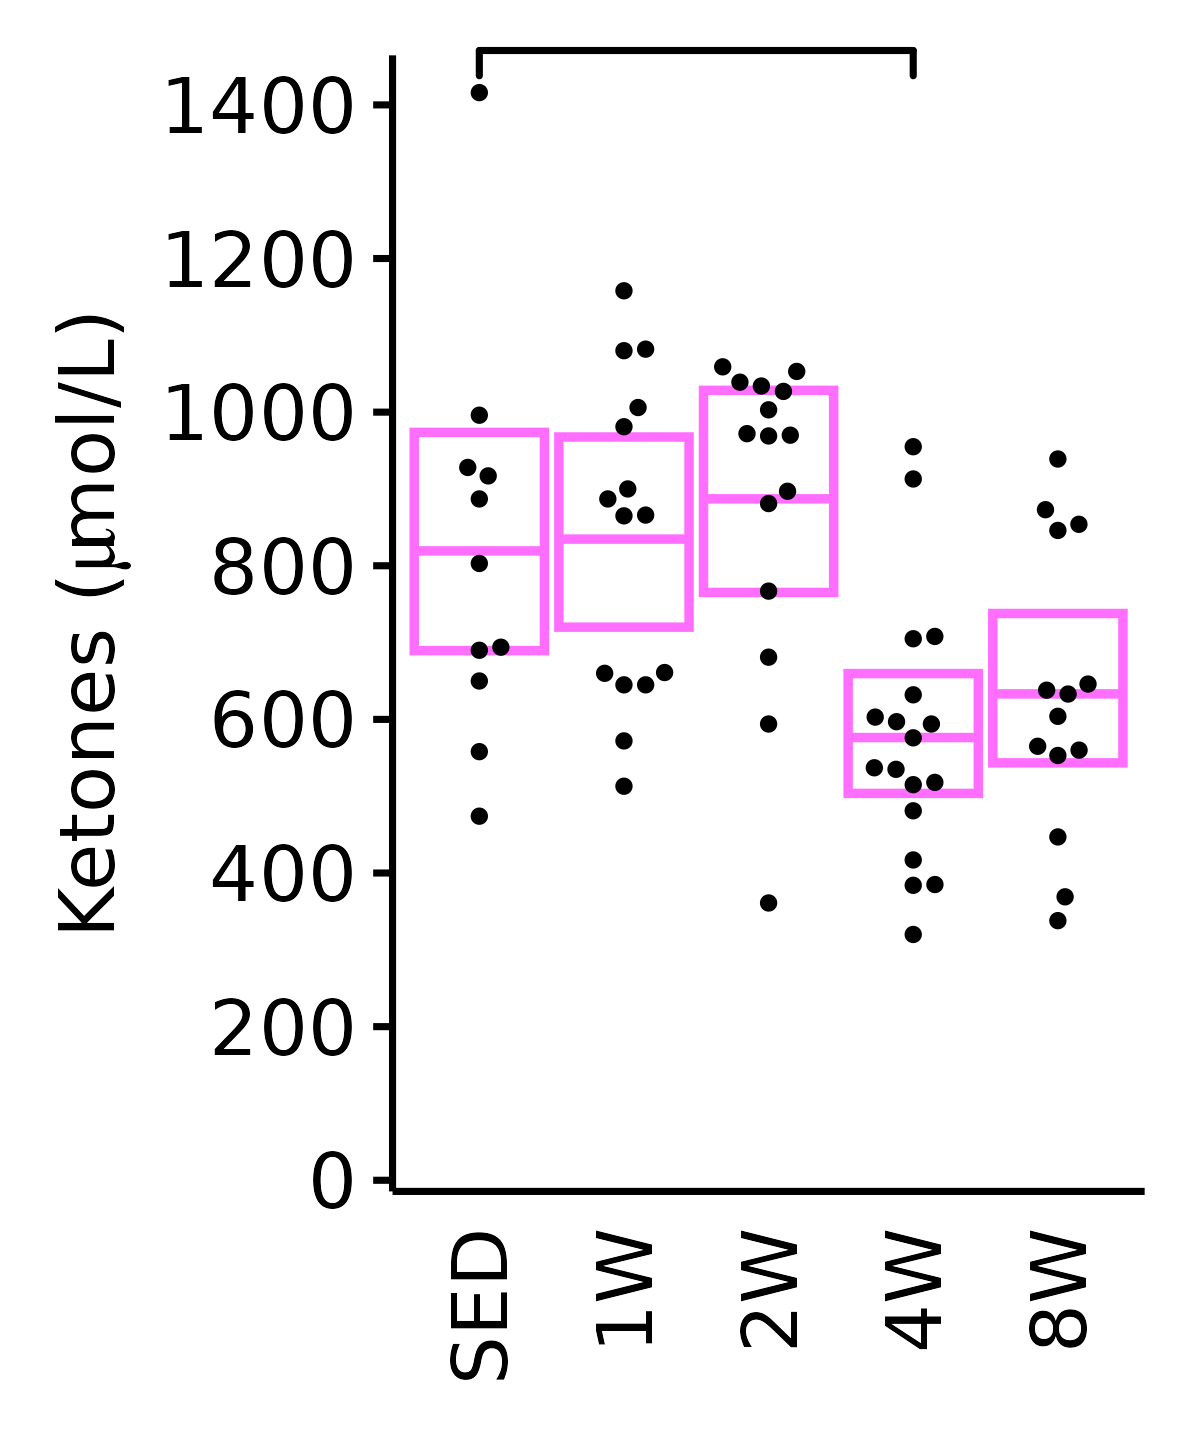
6M Male
plot_baseline(ANALYTES,
              response = "ketones",
              conf = filter(conf_df, response == "Ketones"),
              stats = filter(ANALYTES_STATS, response == "Ketones"),
              sex = "Male", age = "6M") +
  scale_y_continuous(name = TeX("Ketones ($\\mu$mol/L)"),
                     breaks = seq(0, 1400, 200),
                     expand = expansion(mult = 1e-2)) +
  coord_cartesian(ylim = c(0, 1450), clip = "off") +
  theme(plot.margin = unit(c(5, 5, 5, 5), units = "pt"))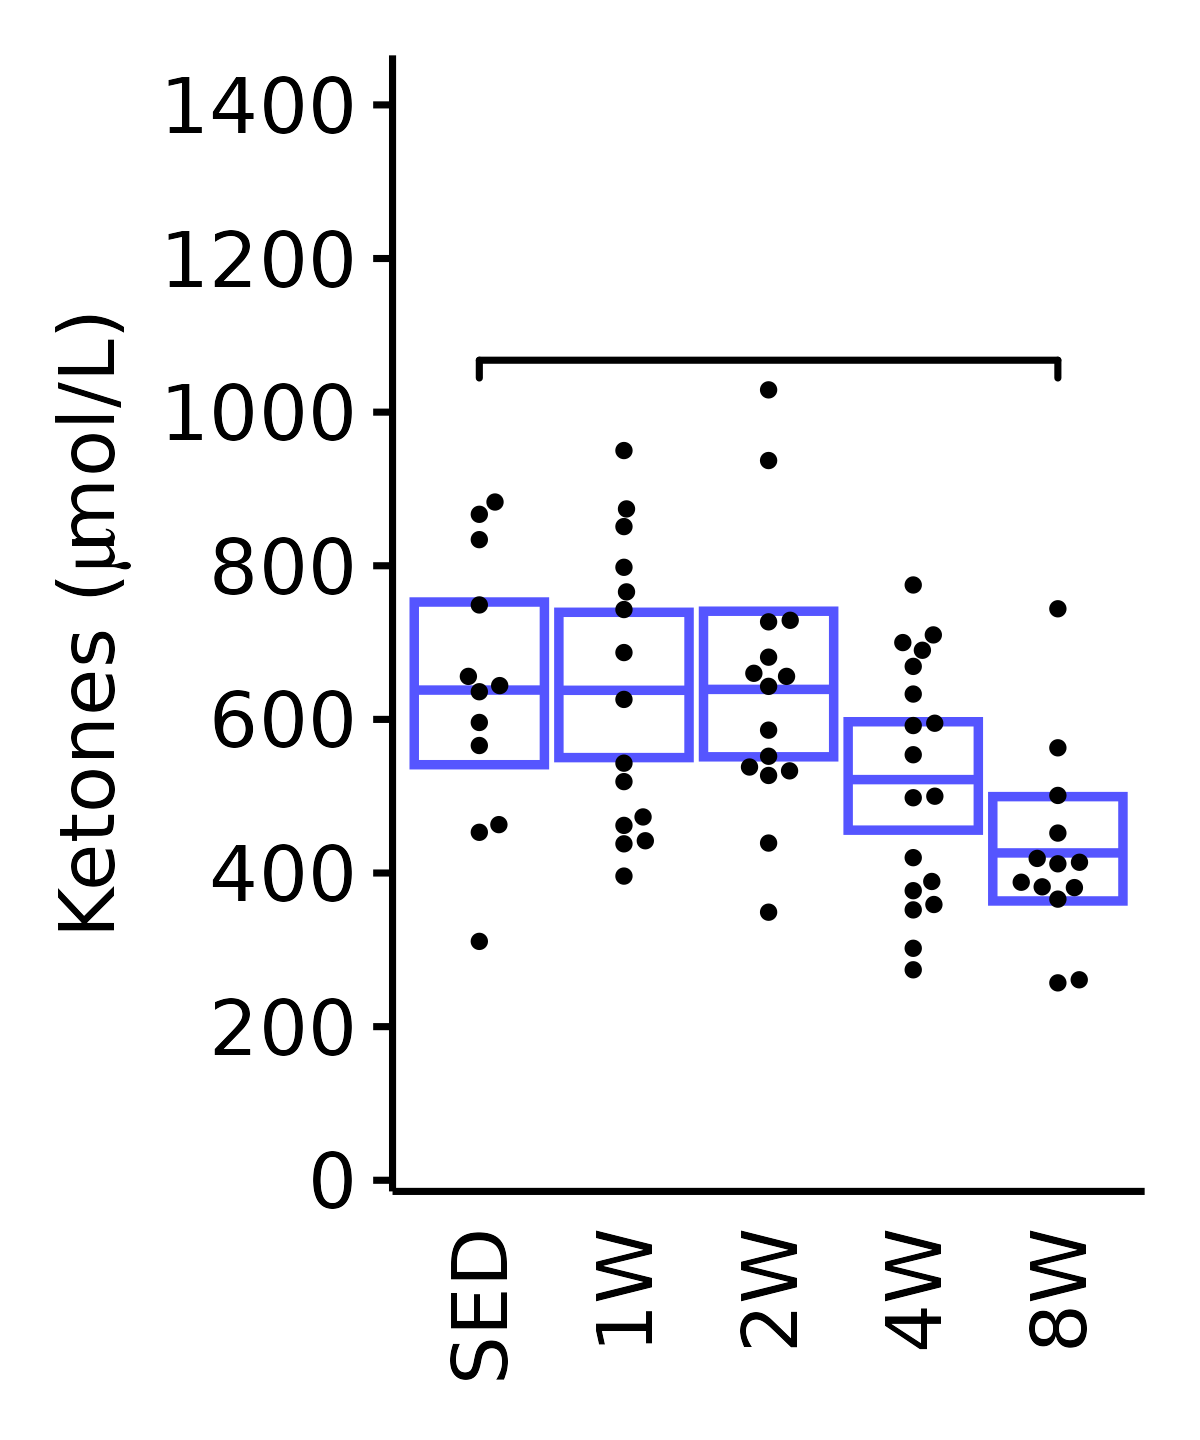
18M Female
plot_baseline(ANALYTES,
              response = "ketones",
              conf = filter(conf_df, response == "Ketones"),
              stats = filter(ANALYTES_STATS, response == "Ketones"),
              sex = "Female", age = "18M") +
  labs(y = TeX("Ketones ($\\mu$mol/L)")) +
  scale_y_continuous(name = TeX("Ketones ($\\mu$mol/L)"),
                     breaks = seq(0, 1400, 200),
                     expand = expansion(mult = 1e-2)) +
  coord_cartesian(ylim = c(0, 1450), clip = "off") +
  theme(plot.margin = unit(c(5, 5, 5, 5), units = "pt"))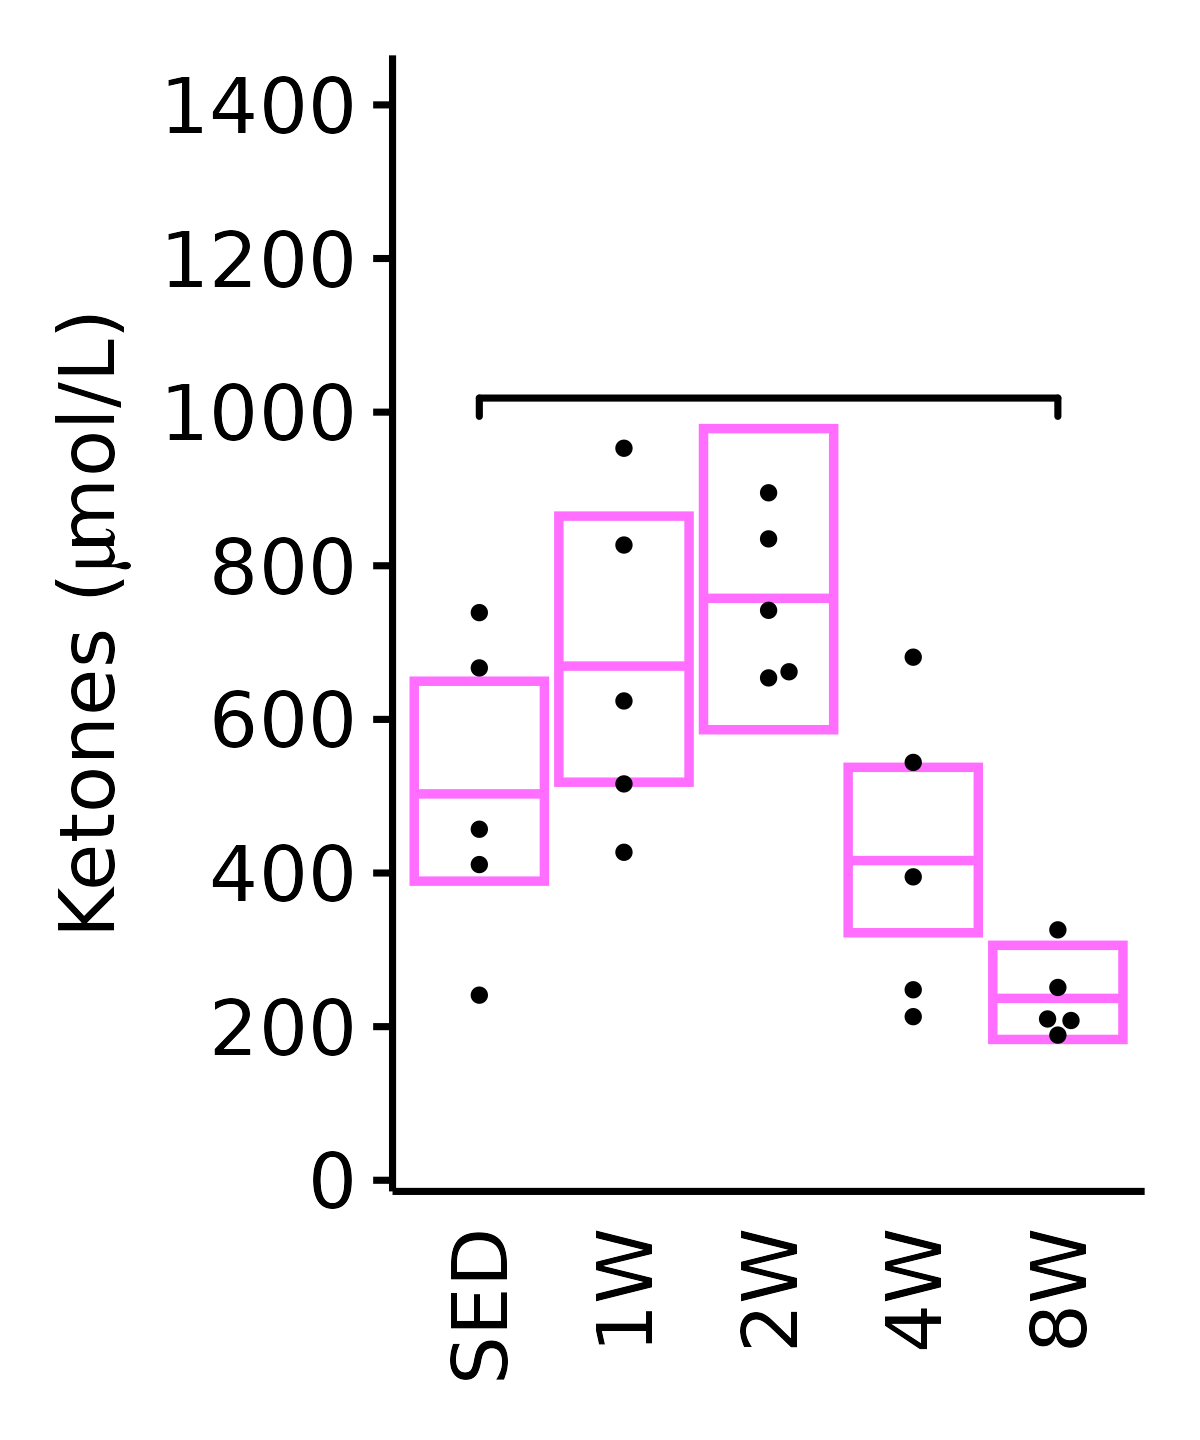
18M Male
plot_baseline(ANALYTES,
              response = "ketones",
              conf = filter(conf_df, response == "Ketones"),
              stats = filter(ANALYTES_STATS, response == "Ketones"),
              sex = "Male", age = "18M") +
  scale_y_continuous(name = TeX("Ketones ($\\mu$mol/L)"),
                     breaks = seq(0, 1400, 200),
                     expand = expansion(mult = 1e-2)) +
  coord_cartesian(ylim = c(0, 1450), clip = "off") +
  theme(plot.margin = unit(c(5, 5, 5, 5), units = "pt"))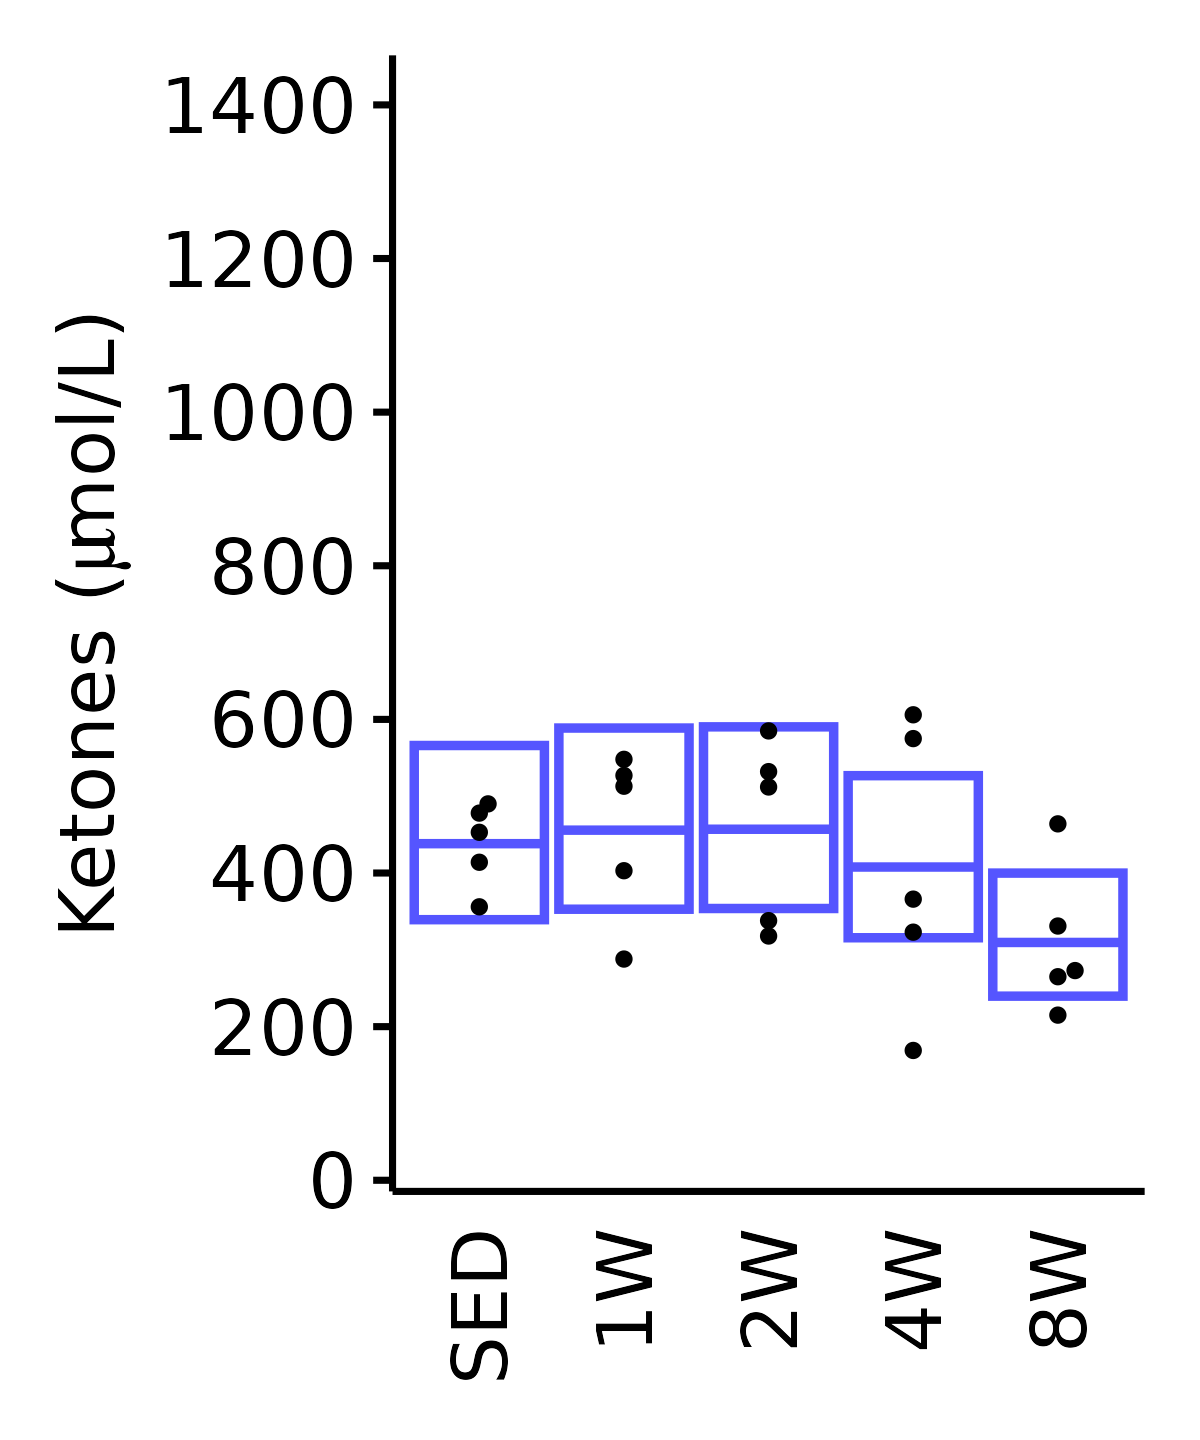
Lactate
Lactate (mmol/L).
6M Female
plot_baseline(ANALYTES,
              response = "lactate",
              conf = filter(conf_df, response == "Lactate"),
              stats = filter(ANALYTES_STATS, response == "Lactate"),
              sex = "Female", age = "6M", y_position = 1.85) +
  scale_y_continuous(name = "Lactate (mmol/L)",
                     breaks = seq(0, 3, 0.5),
                     expand = expansion(mult = 1e-2)) +
  coord_cartesian(ylim = c(0, 3), clip = "off") +
  theme(plot.margin = unit(c(12, 5, 5, 5), units = "pt"))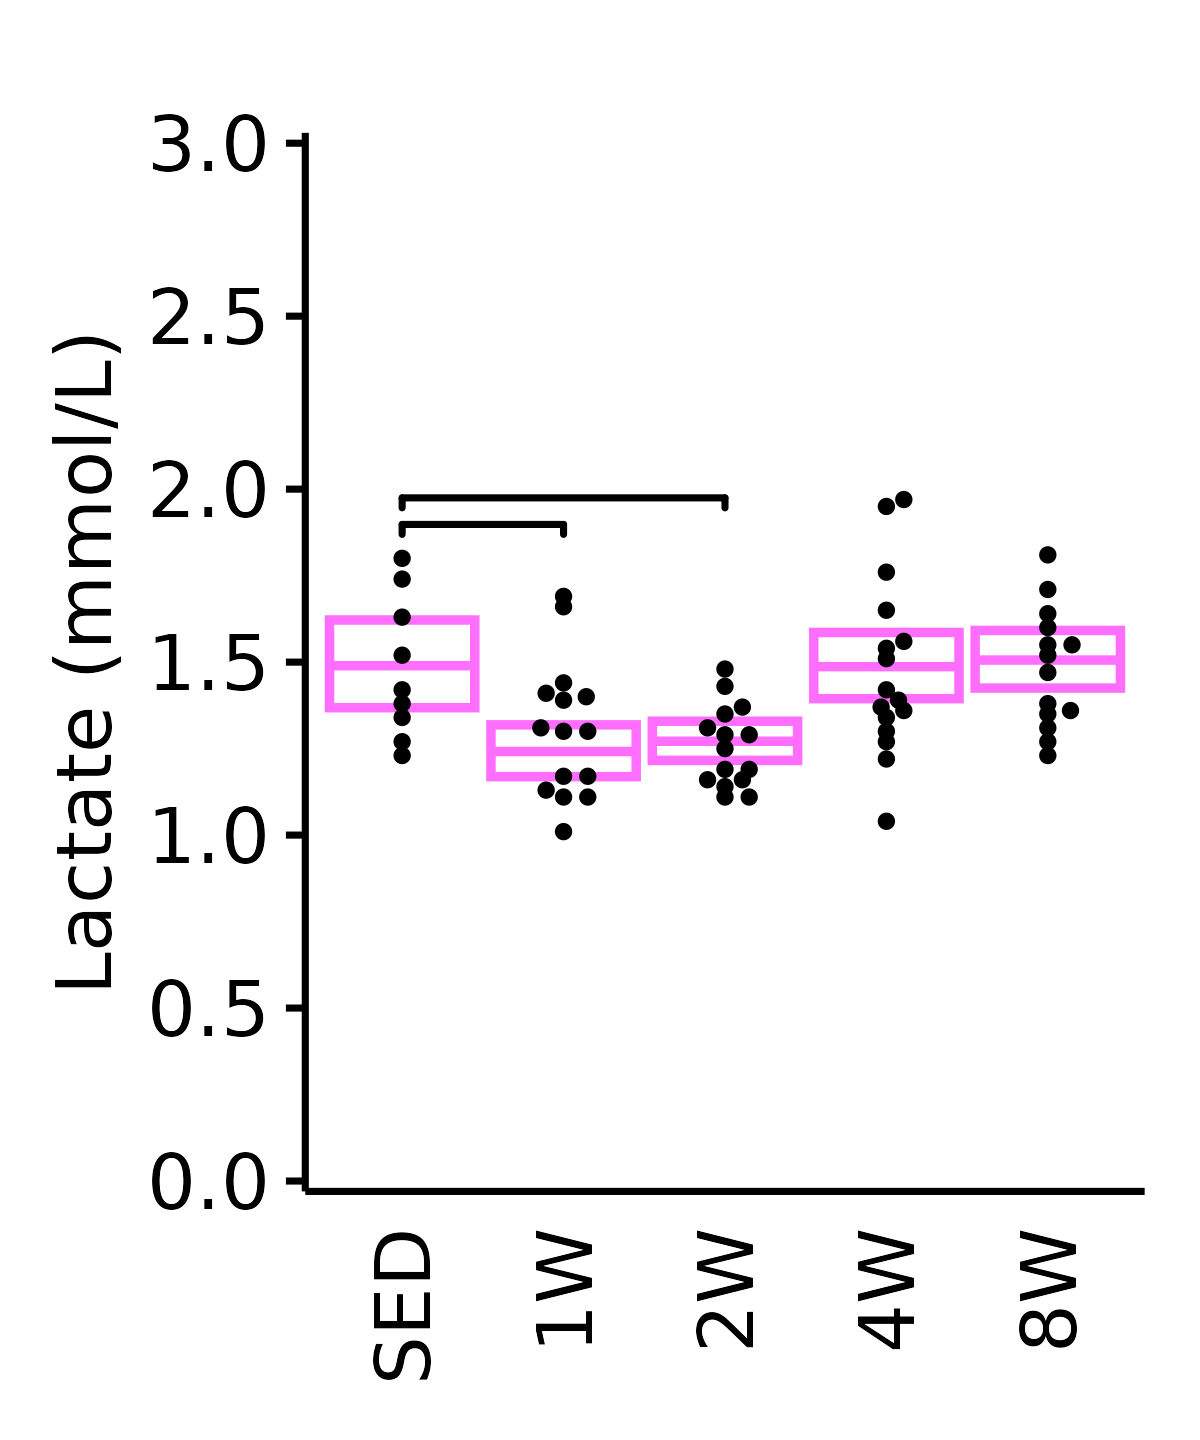
6M Male
plot_baseline(ANALYTES,
              response = "lactate",
              conf = filter(conf_df, response == "Lactate"),
              stats = filter(ANALYTES_STATS, response == "Lactate"),
              sex = "Male", age = "6M") +
  scale_y_continuous(name = "Lactate (mmol/L)",
                     breaks = seq(0, 3, 0.5),
                     expand = expansion(mult = 1e-2)) +
  coord_cartesian(ylim = c(0, 3), clip = "off") +
  theme(plot.margin = unit(c(12, 5, 5, 5), units = "pt"))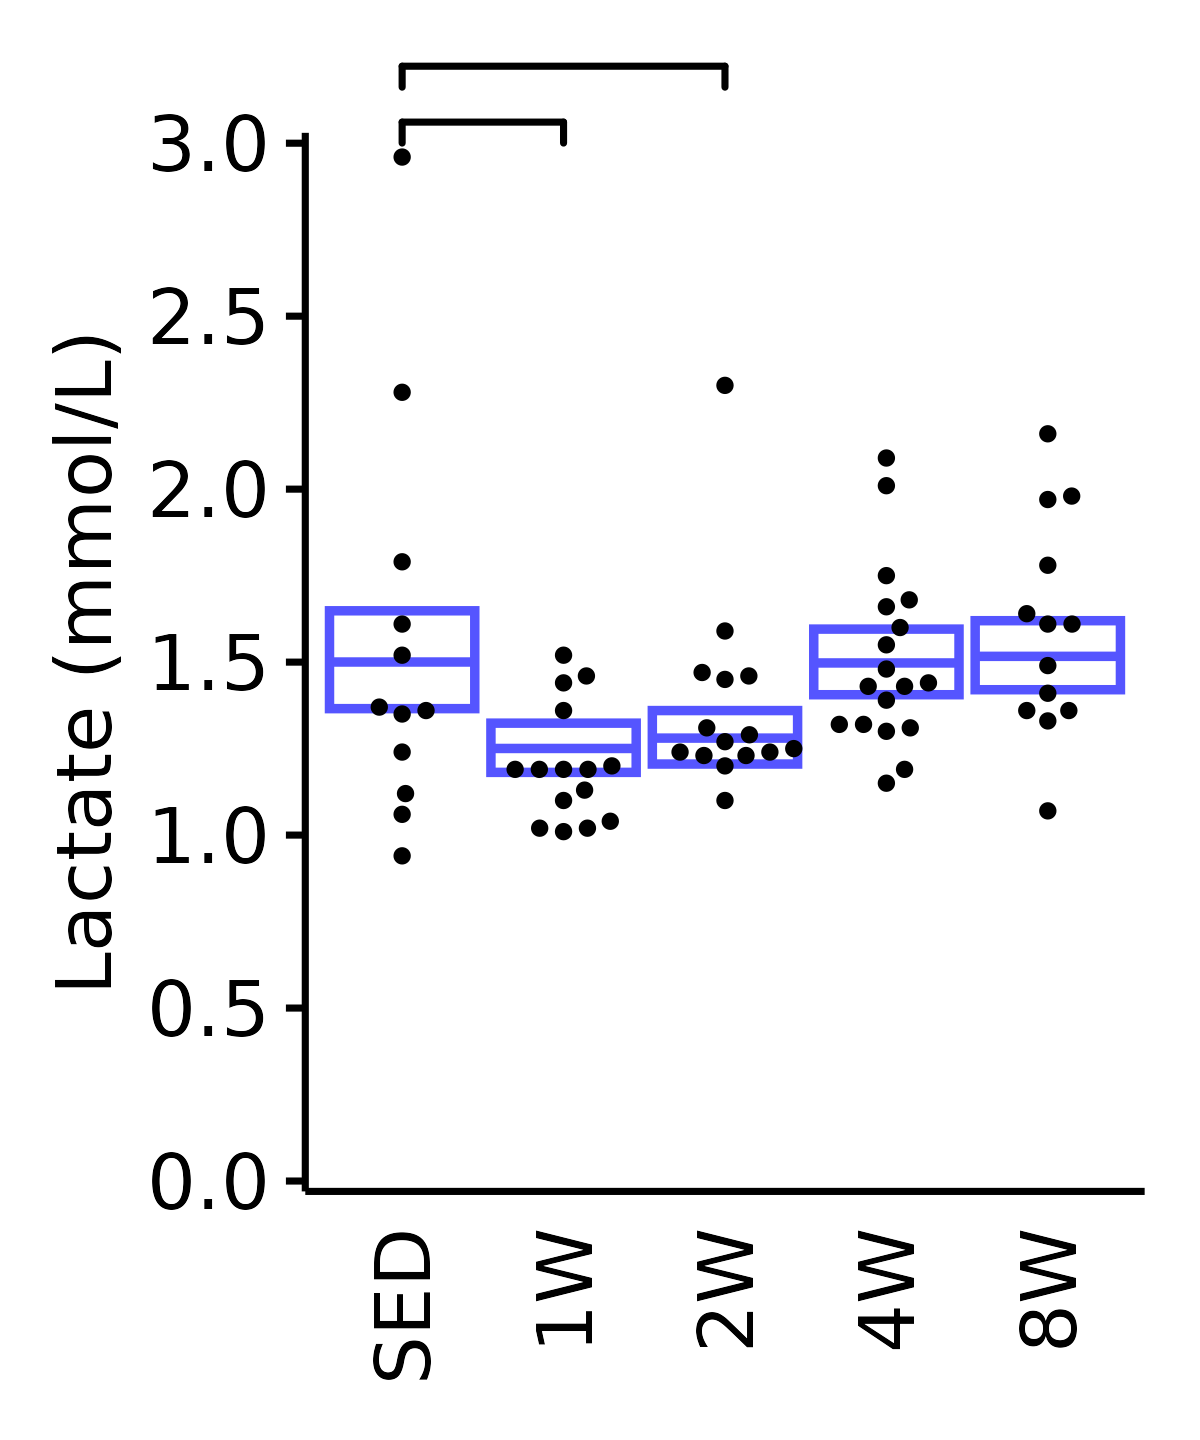
18M Female
plot_baseline(ANALYTES,
              response = "lactate",
              conf = filter(conf_df, response == "Lactate"),
              stats = filter(ANALYTES_STATS, response == "Lactate"),
              sex = "Female", age = "18M", y_position = 2.25) +
  scale_y_continuous(name = "Lactate (mmol/L)",
                     breaks = seq(0, 3, 0.5),
                     expand = expansion(mult = 1e-2)) +
  coord_cartesian(ylim = c(0, 3), clip = "off") +
  theme(plot.margin = unit(c(12, 5, 5, 5), units = "pt"))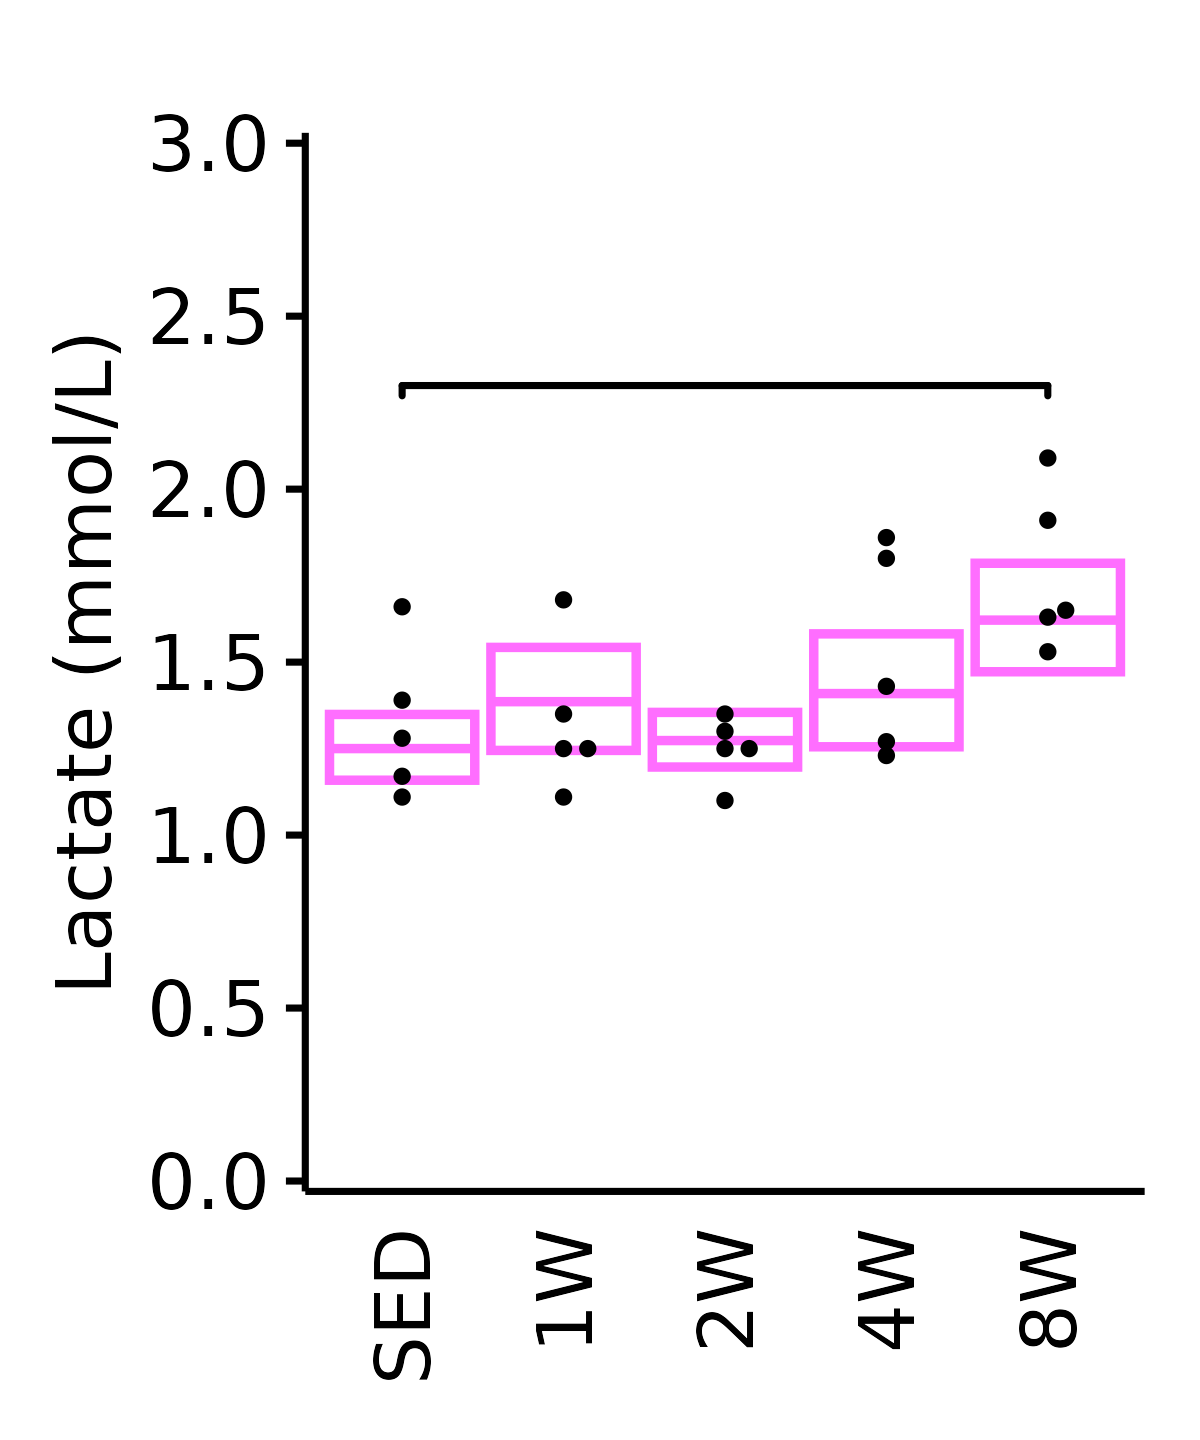
18M Male
plot_baseline(ANALYTES,
              response = "lactate",
              conf = filter(conf_df, response == "Lactate"),
              stats = filter(ANALYTES_STATS, response == "Lactate"),
              sex = "Male", age = "18M", y_position = 2) +
  scale_y_continuous(name = "Lactate (mmol/L)",
                     breaks = seq(0, 3, 0.5),
                     expand = expansion(mult = 1e-2)) +
  coord_cartesian(ylim = c(0, 3), clip = "off") +
  theme(plot.margin = unit(c(12, 5, 5, 5), units = "pt"))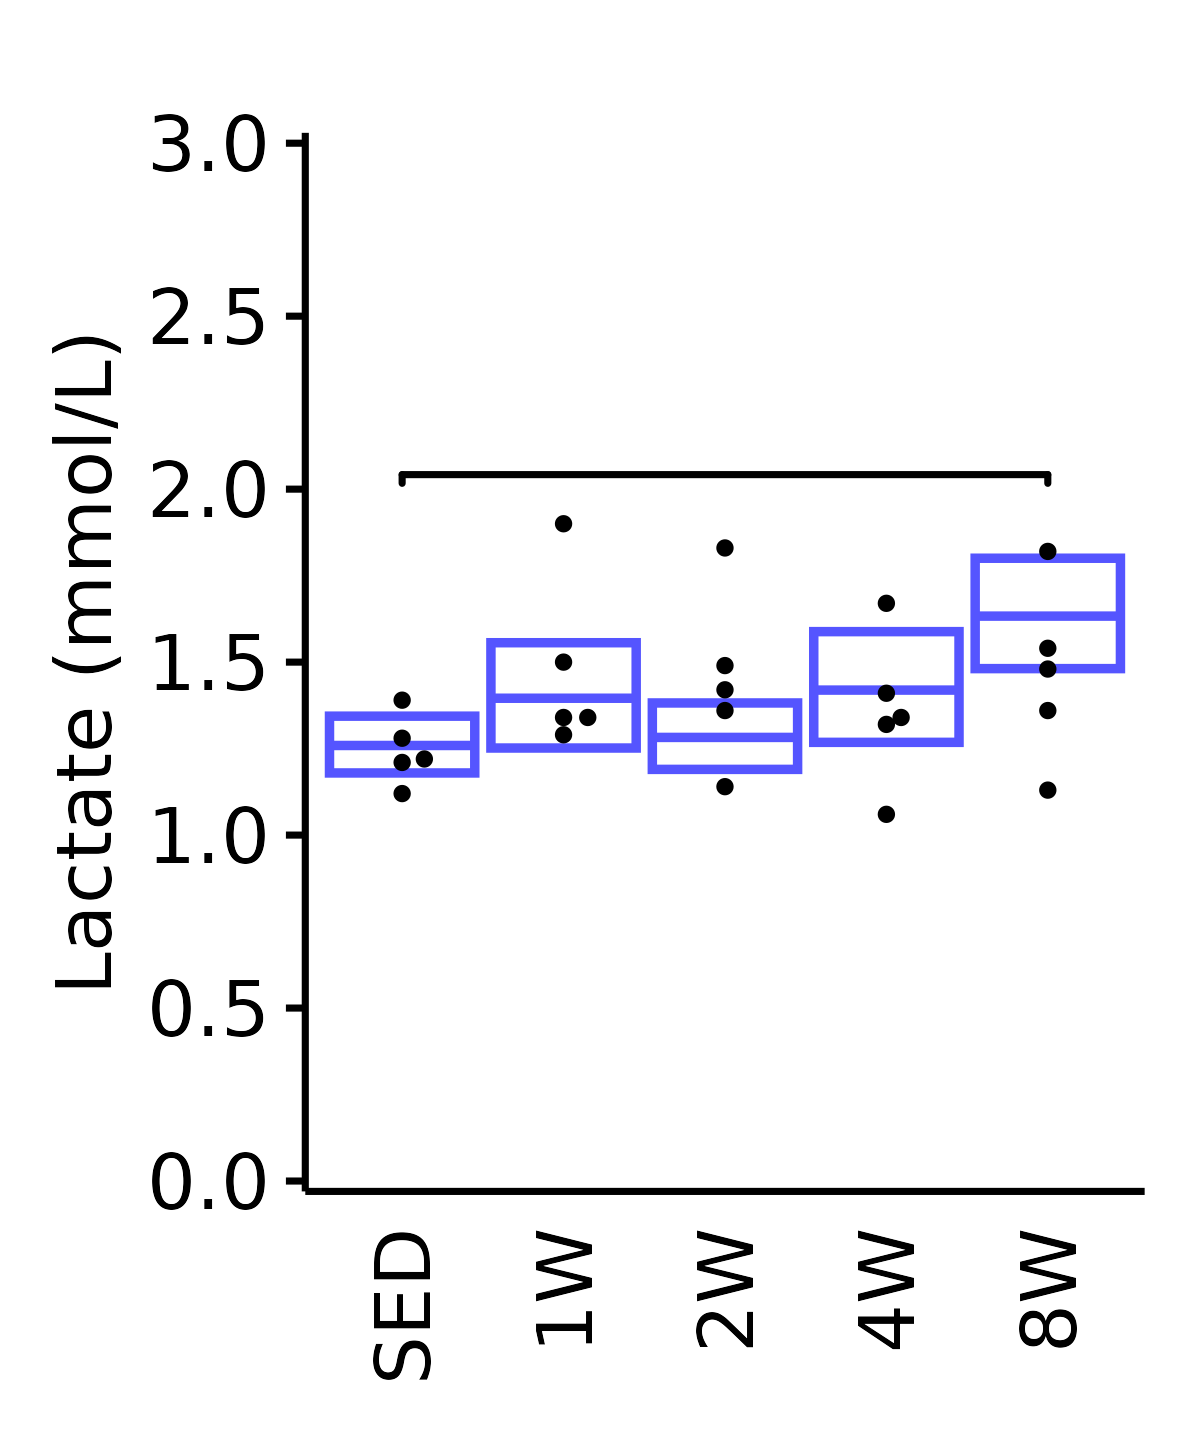
Leptin
Leptin (pg/mL).
6M Female
plot_baseline(ANALYTES,
              response = "leptin",
              conf = filter(conf_df, response == "Leptin"),
              stats = filter(ANALYTES_STATS, response == "Leptin"),
              sex = "Female", age = "6M", y_position = 3.1e4,
              step_increase = 0.12) +
  scale_y_continuous(name = "Leptin (pg/mL)",
                     labels = scales::label_scientific(),
                     breaks = seq(0, 7e4, 2e4),
                     limits = c(0, 7e4),
                     expand = expansion(mult = 1e-2)) +
  coord_cartesian(clip = "off", ylim = c(0, 7e4)) +
  theme(plot.margin = unit(c(12, 5, 5, 5), units = "pt"))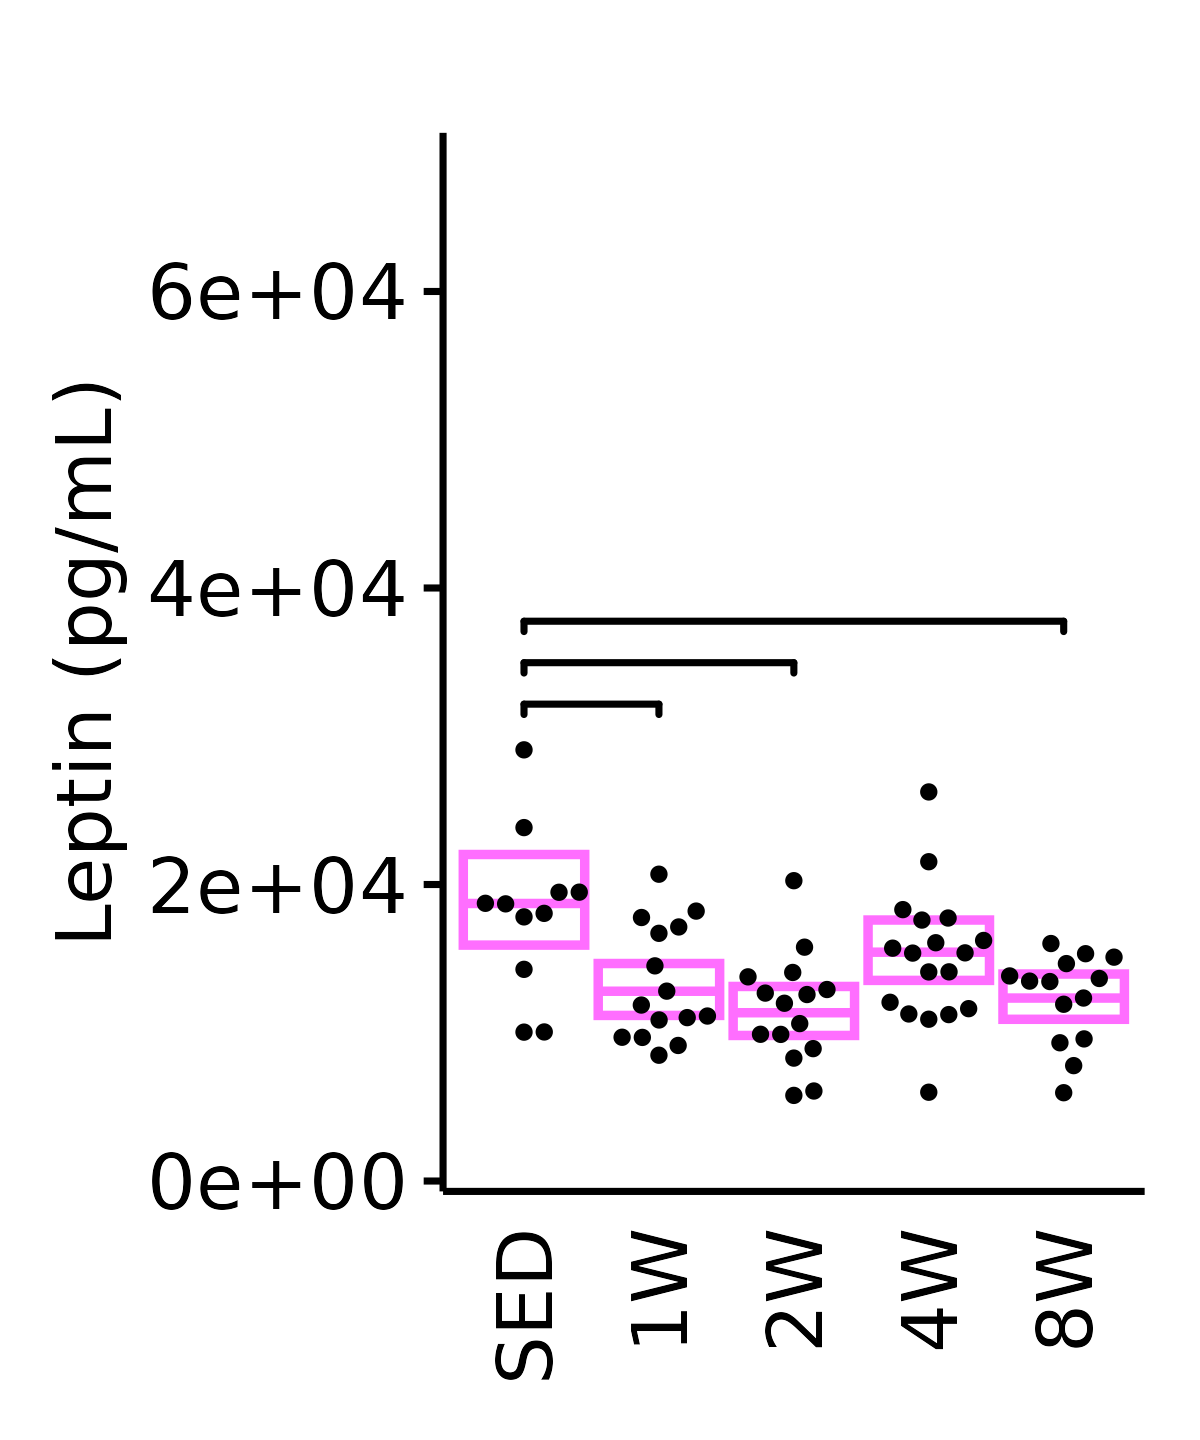
6M Male
plot_baseline(ANALYTES,
              response = "leptin",
              conf = filter(conf_df, response == "Leptin"),
              stats = filter(ANALYTES_STATS, response == "Leptin"),
              sex = "Male", age = "6M") +
  scale_y_continuous(name = "Leptin (pg/mL)",
                     labels = scales::label_scientific(),
                     breaks = seq(0, 7e4, 2e4),
                     expand = expansion(mult = 1e-2)) +
  coord_cartesian(ylim = c(0, 7e4), clip = "off") +
  theme(plot.margin = unit(c(12, 5, 5, 5), units = "pt"))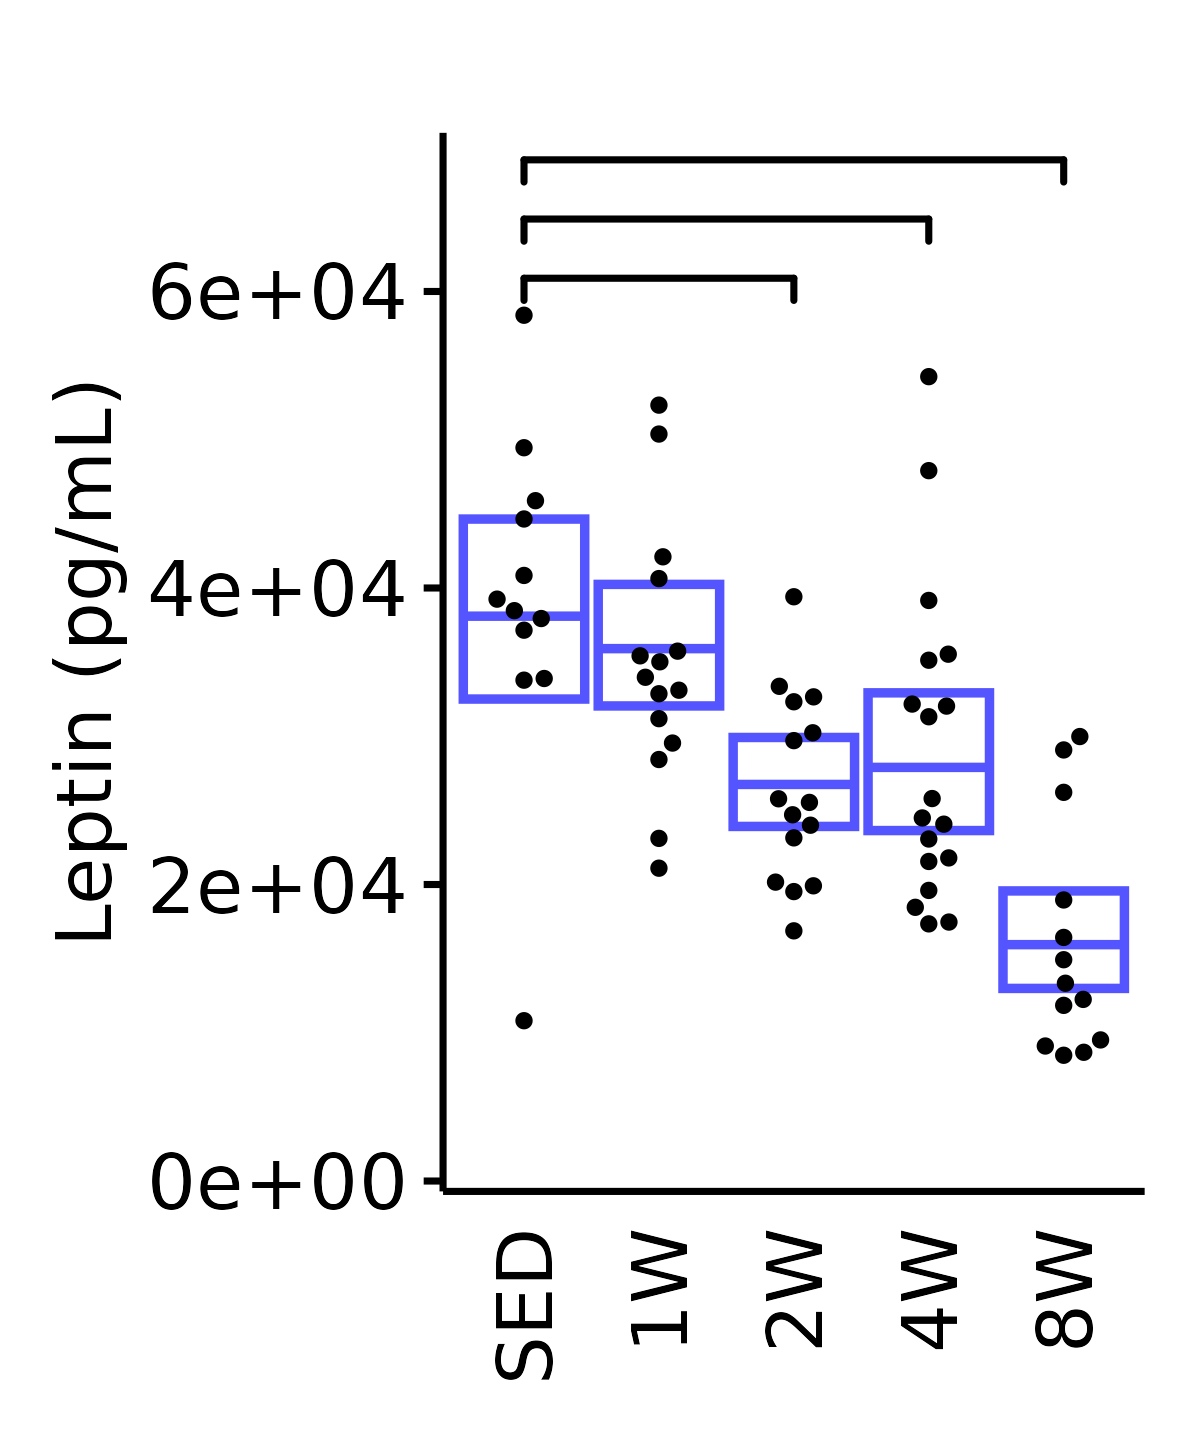
18M Female
plot_baseline(ANALYTES,
              response = "leptin",
              conf = filter(conf_df, response == "Leptin"),
              stats = filter(ANALYTES_STATS, response == "Leptin"),
              sex = "Female", age = "18M") +
  scale_y_continuous(name = "Leptin (pg/mL)",
                     labels = scales::label_scientific(),
                     breaks = seq(0, 7e4, 2e4),
                     expand = expansion(mult = 1e-2)) +
  coord_cartesian(ylim = c(0, 7e4), clip = "off") +
  theme(plot.margin = unit(c(12, 5, 5, 5), units = "pt"))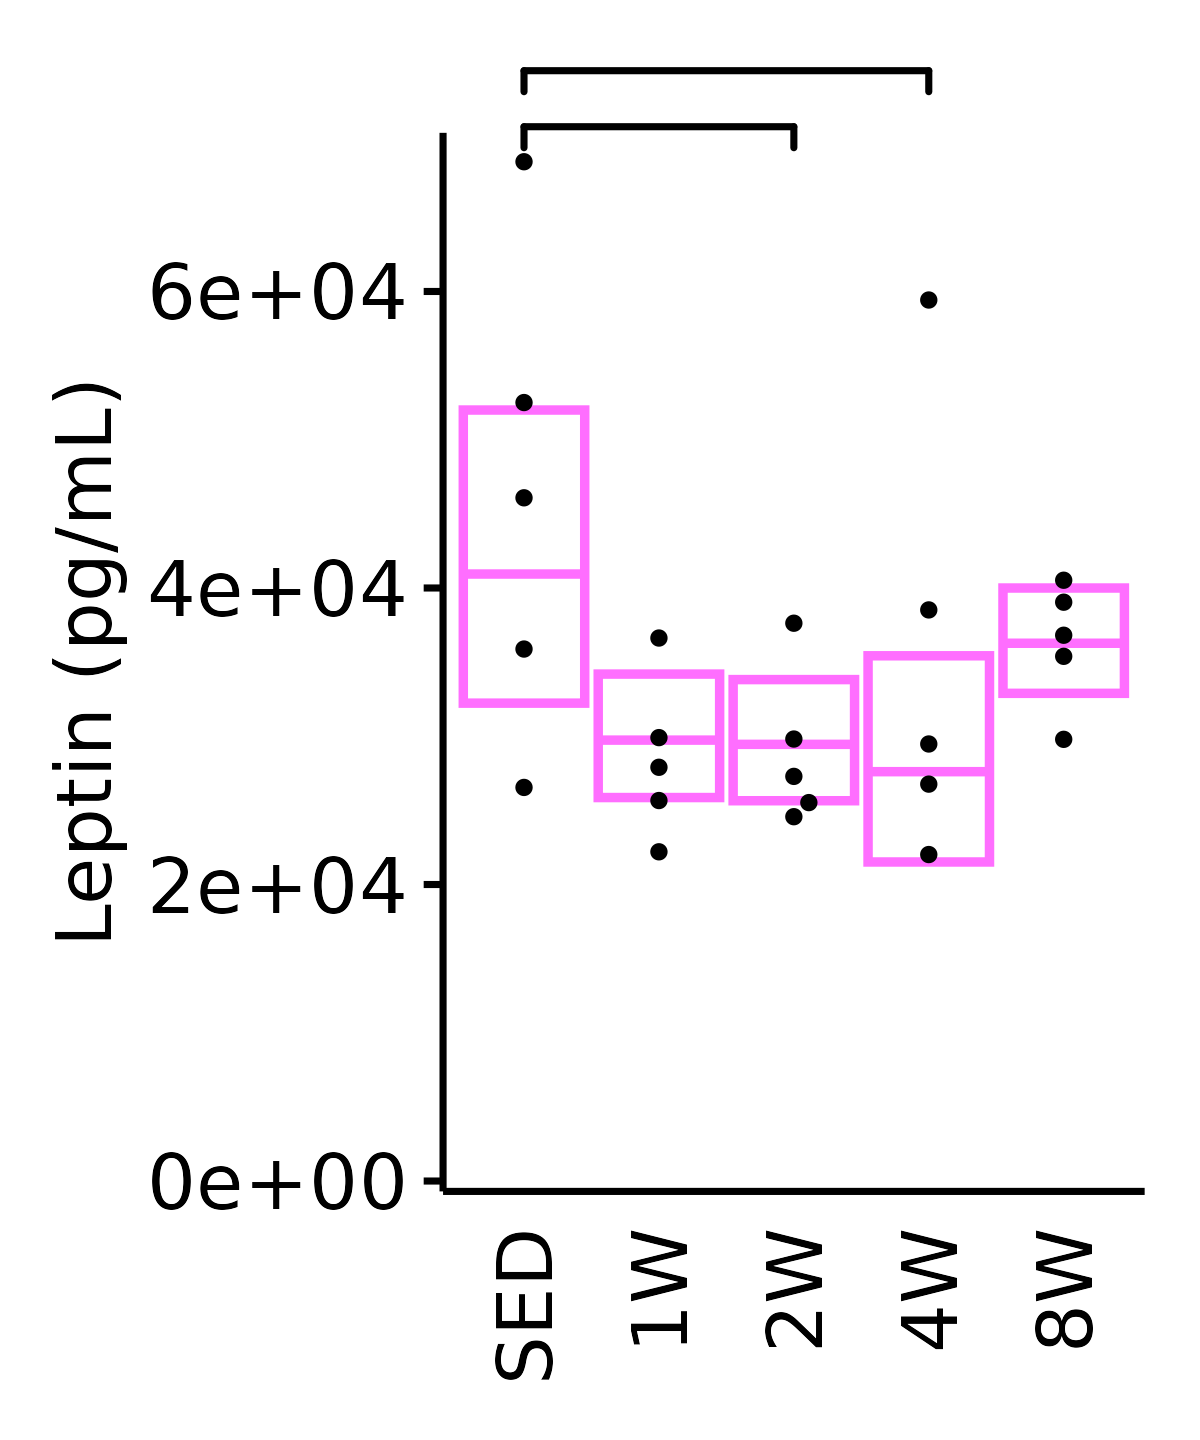
18M Male
plot_baseline(ANALYTES,
              response = "leptin",
              conf = filter(conf_df, response == "Leptin"),
              stats = filter(ANALYTES_STATS, response == "Leptin"),
              sex = "Male", age = "18M", y_position = 6e4) +
  scale_y_continuous(name = "Leptin (pg/mL)",
                     labels = scales::label_scientific(),
                     breaks = seq(0, 7e4, 2e4),
                     expand = expansion(mult = 1e-2)) +
  coord_cartesian(ylim = c(0, 7e4), clip = "off") +
  theme(plot.margin = unit(c(12, 5, 5, 5), units = "pt"))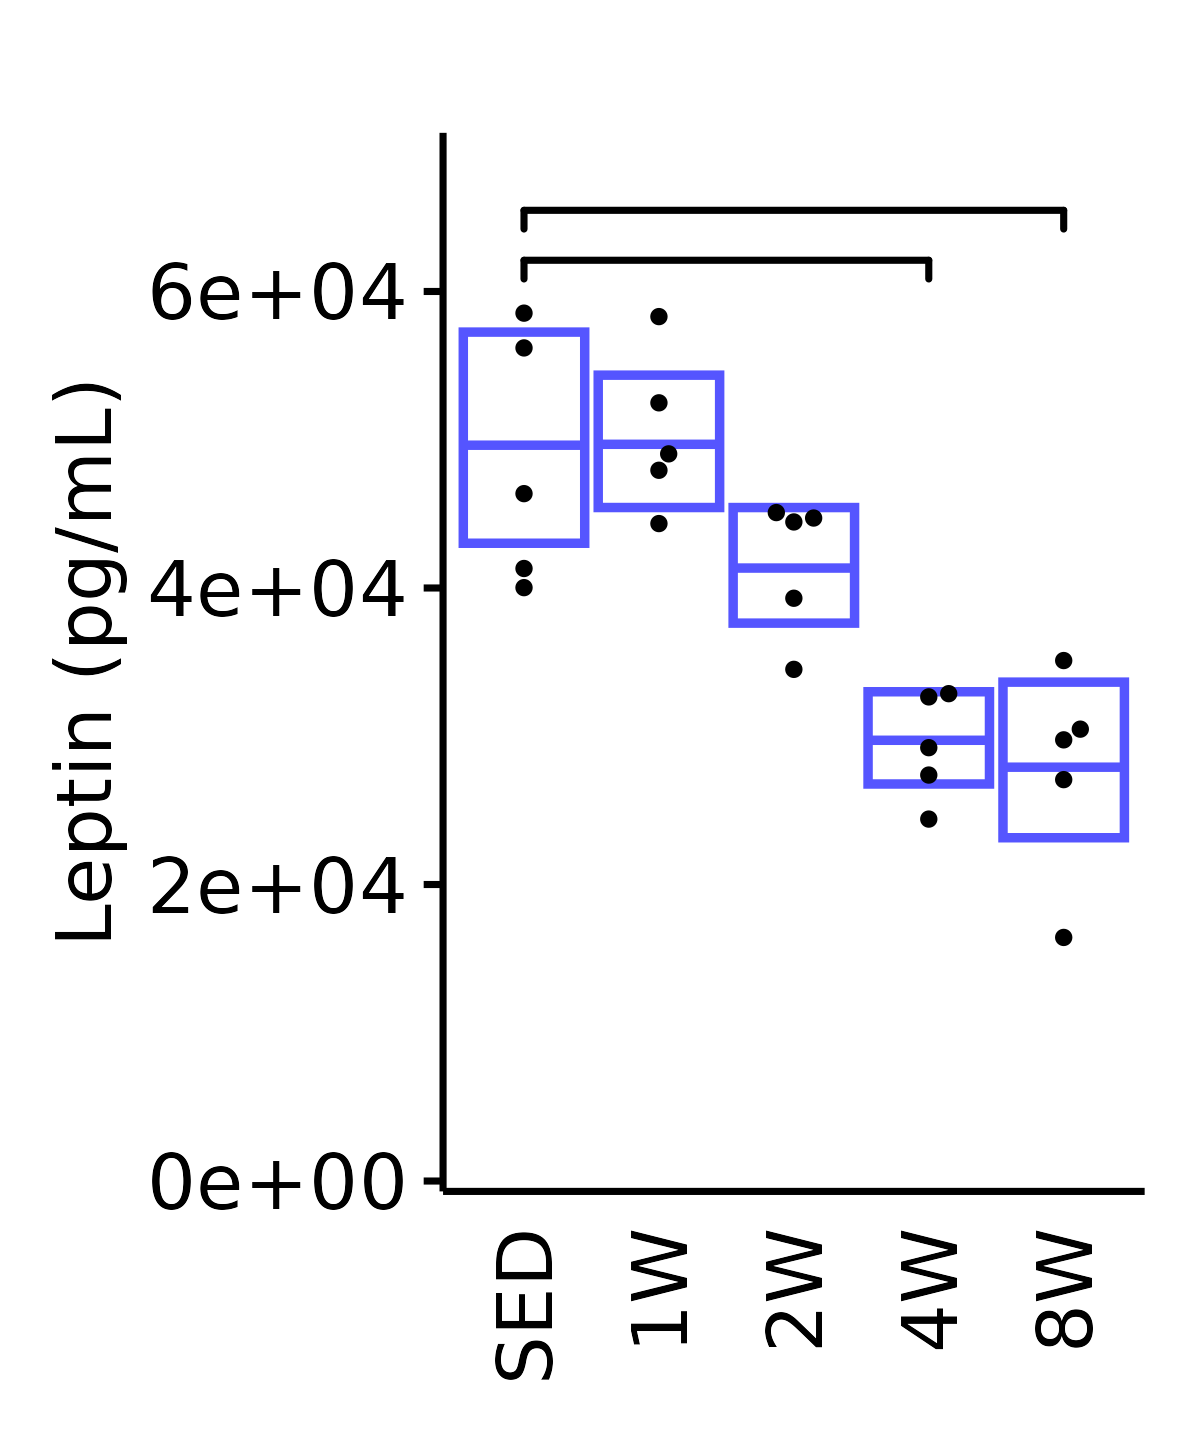
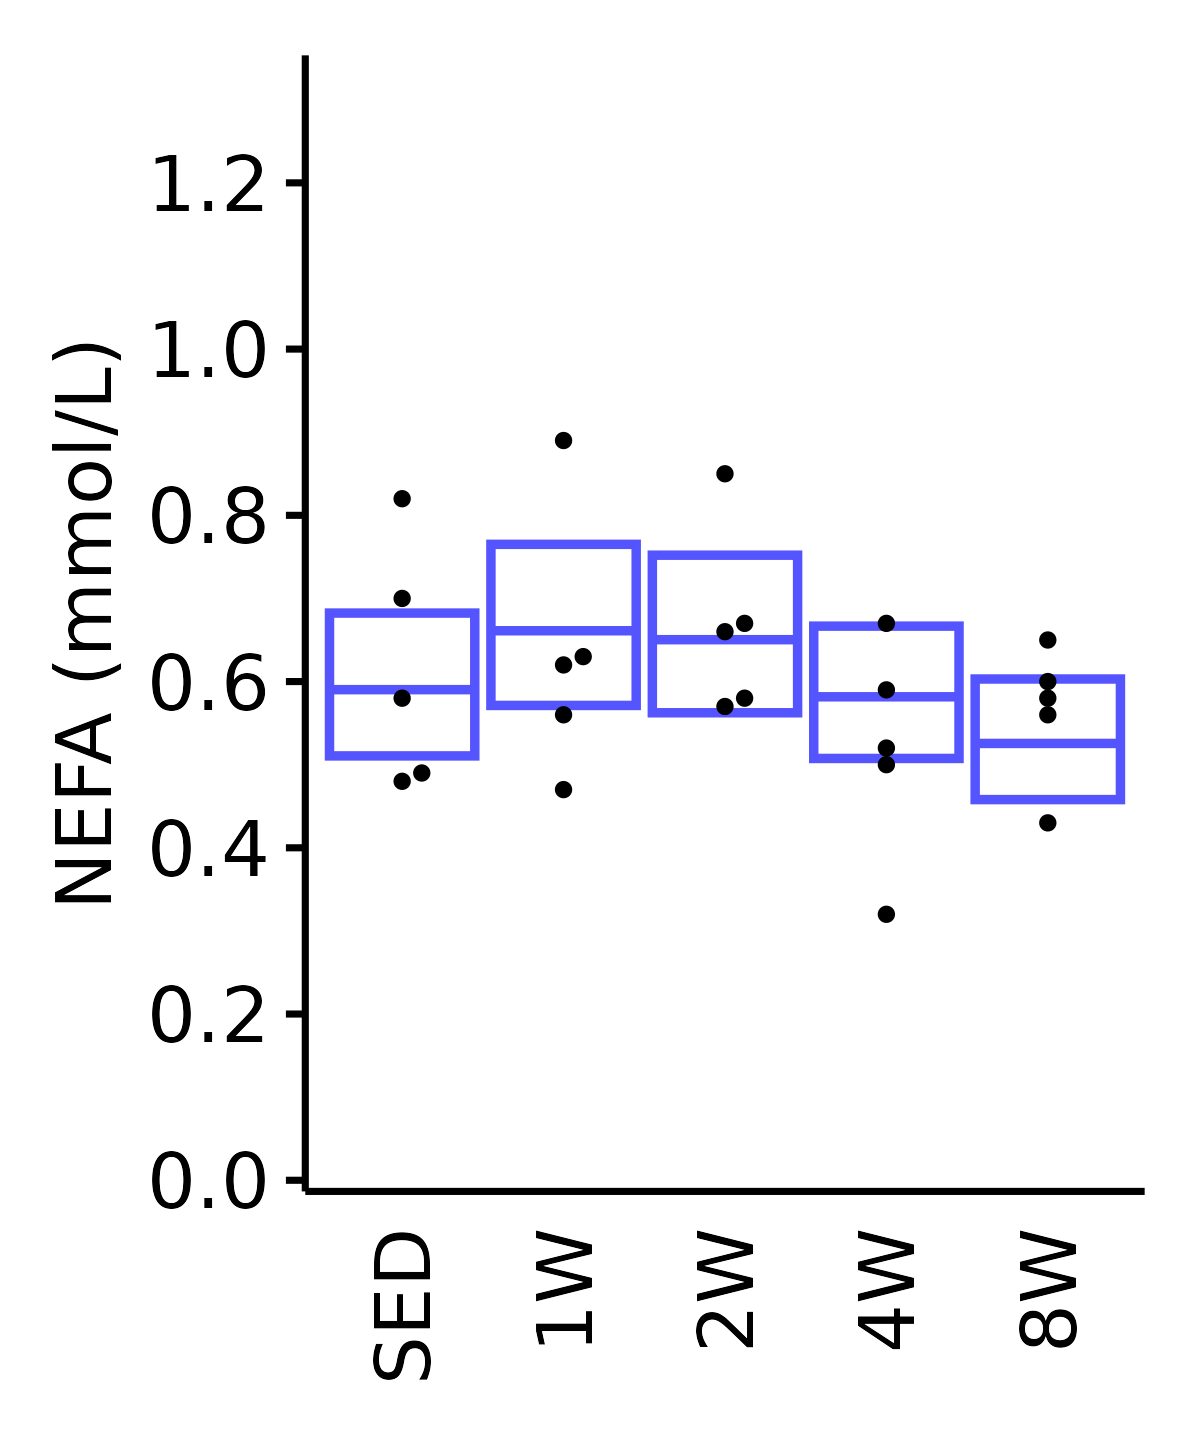
NEFA
NEFA (mmol/L).
6M Female
plot_baseline(ANALYTES,
              response = "nefa",
              conf = filter(conf_df, response == "NEFA"),
              stats = filter(ANALYTES_STATS, response == "NEFA"),
              sex = "Female", age = "6M", y_position = 1.25) +
  scale_y_continuous(name = "NEFA (mmol/L)",
                     breaks = seq(0, 1.3, 0.2),
                     expand = expansion(mult = 1e-2)) +
  coord_cartesian(ylim = c(0, 1.34), clip = "off") +
  theme(plot.margin = unit(c(5, 5, 5, 5), units = "pt"))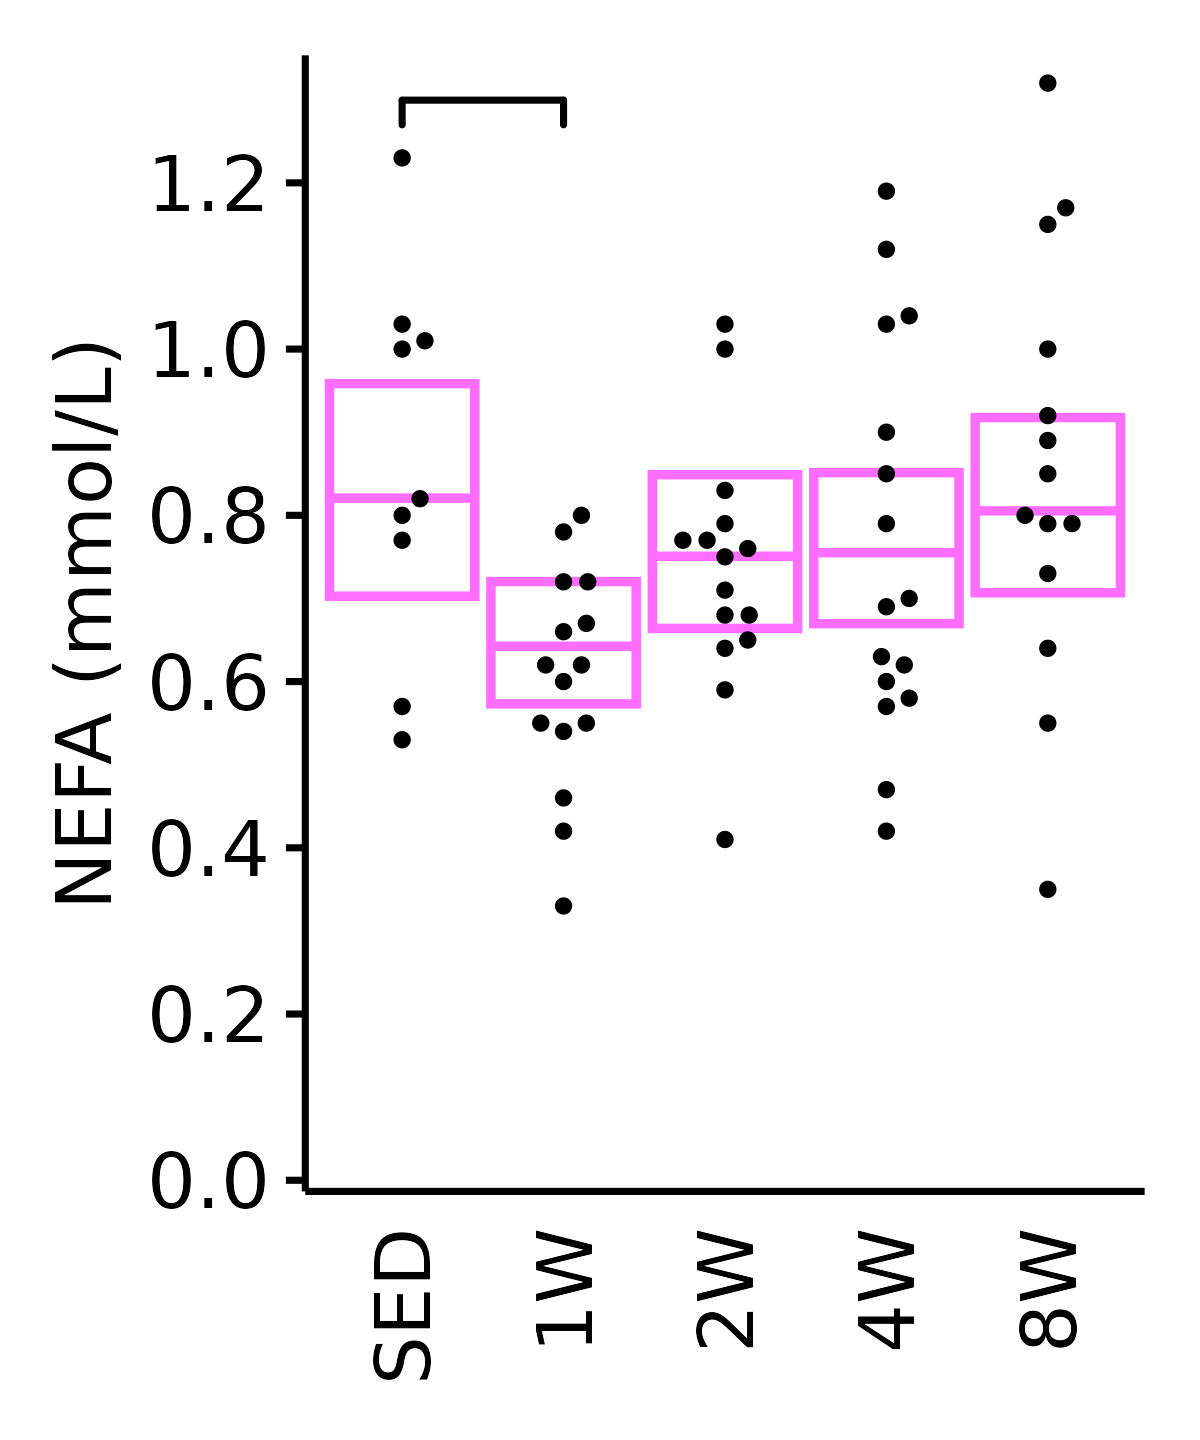
6M Male
plot_baseline(ANALYTES,
              response = "nefa",
              conf = filter(conf_df, response == "NEFA"),
              stats = filter(ANALYTES_STATS, response == "NEFA"),
              sex = "Male", age = "6M") +
  scale_y_continuous(name = "NEFA (mmol/L)",
                     breaks = seq(0, 1.3, 0.2),
                     expand = expansion(mult = 1e-2)) +
  coord_cartesian(ylim = c(0, 1.34), clip = "off") +
  theme(plot.margin = unit(c(5, 5, 5, 5), units = "pt"))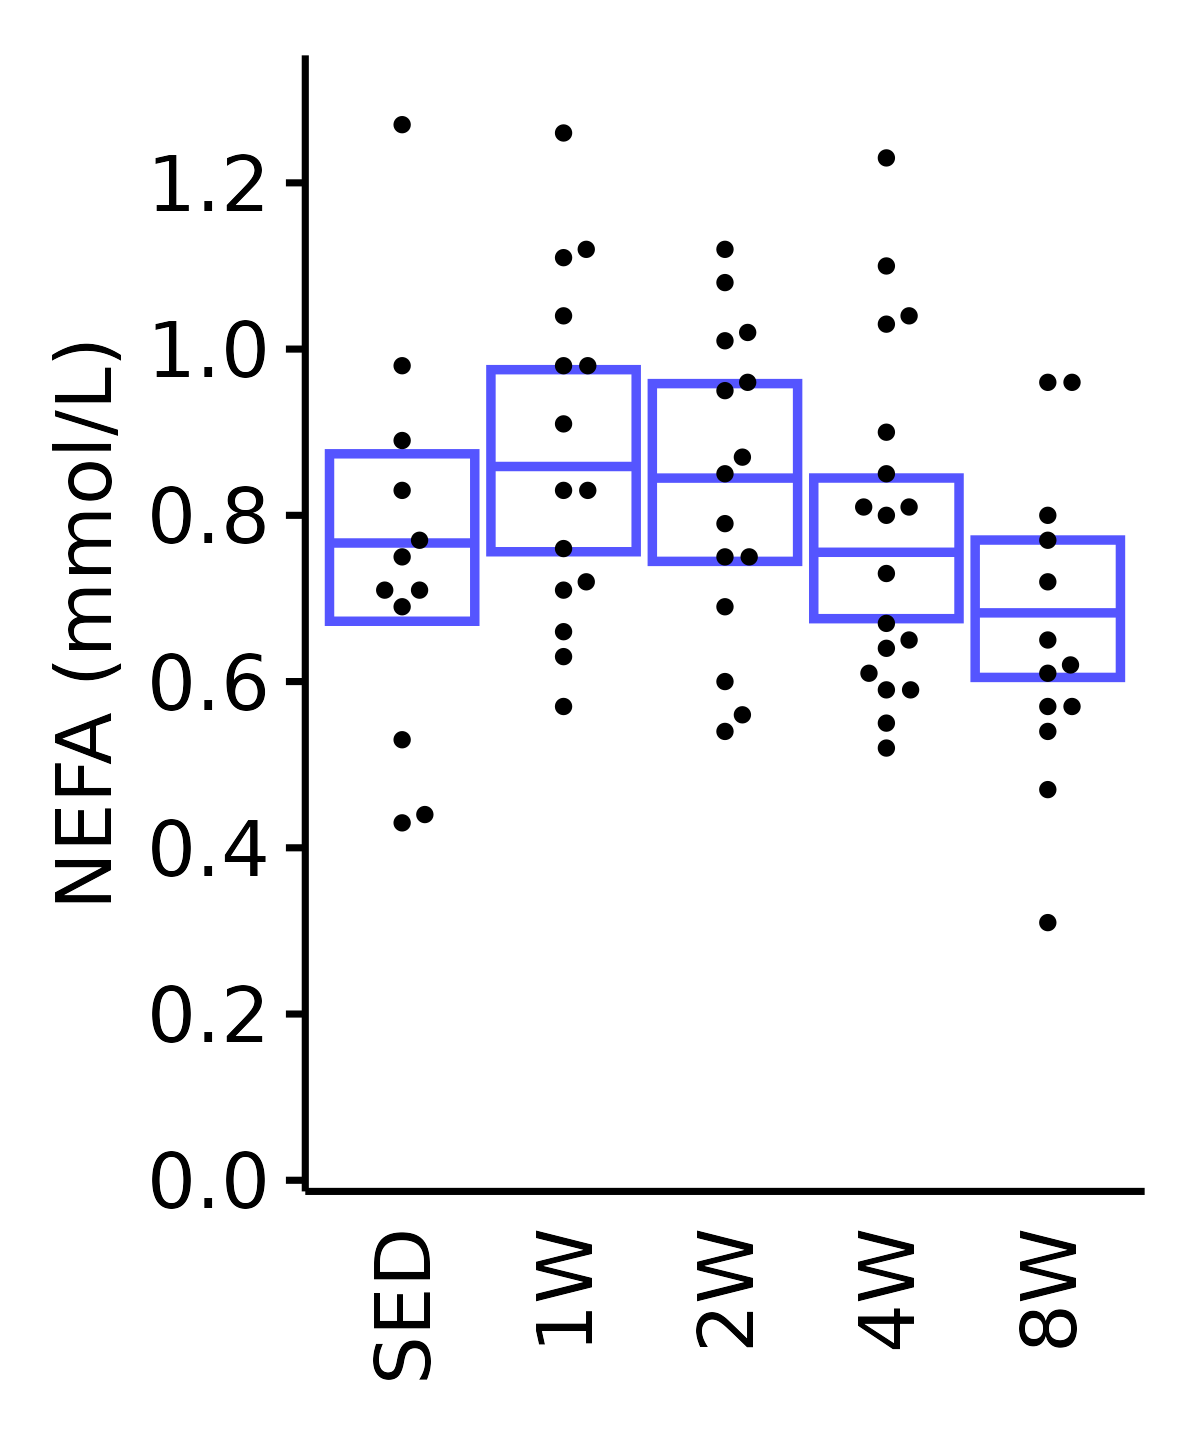
18M Female
plot_baseline(ANALYTES,
              response = "nefa",
              conf = filter(conf_df, response == "NEFA"),
              stats = filter(ANALYTES_STATS, response == "NEFA"),
              sex = "Female", age = "18M", y_position = 1.15) +
  scale_y_continuous(name = "NEFA (mmol/L)",
                     breaks = seq(0, 1.3, 0.2),
                     expand = expansion(mult = 1e-2)) +
  coord_cartesian(ylim = c(0, 1.34), clip = "off") +
  theme(plot.margin = unit(c(5, 5, 5, 5), units = "pt"))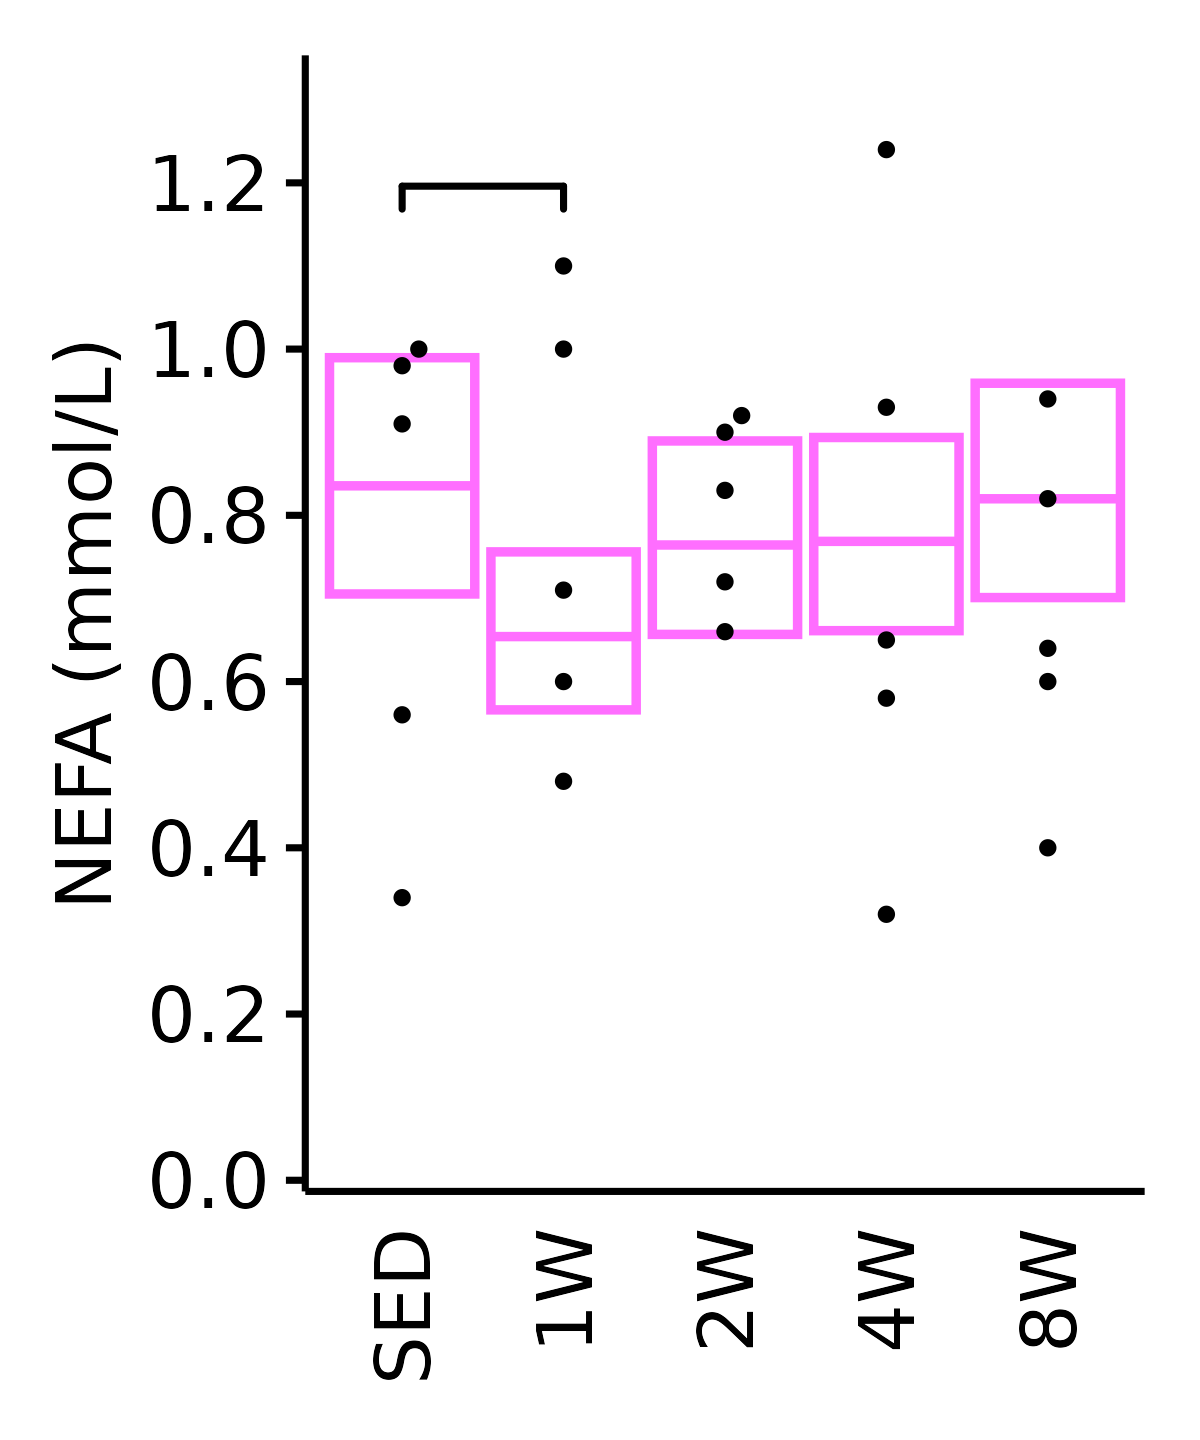
18M Male
plot_baseline(ANALYTES,
              response = "nefa",
              conf = filter(conf_df, response == "NEFA"),
              stats = filter(ANALYTES_STATS, response == "NEFA"),
              sex = "Male", age = "18M") +
  scale_y_continuous(name = "NEFA (mmol/L)",
                     breaks = seq(0, 1.3, 0.2),
                     expand = expansion(mult = 1e-2)) +
  coord_cartesian(ylim = c(0, 1.34), clip = "off") +
  theme(plot.margin = unit(c(5, 5, 5, 5), units = "pt"))