Plots of fiber area by muscle and fiber type
Tyler Sagendorf
01 May, 2024
Source:vignettes/articles/fiber_area_plots.Rmd
fiber_area_plots.Rmd
# Required packages
library(MotrpacRatTrainingPhysiologyData)
library(dplyr)
library(ggplot2)
library(latex2exp)
library(tidyr)
library(tibble)
library(purrr)
library(emmeans)
Overview
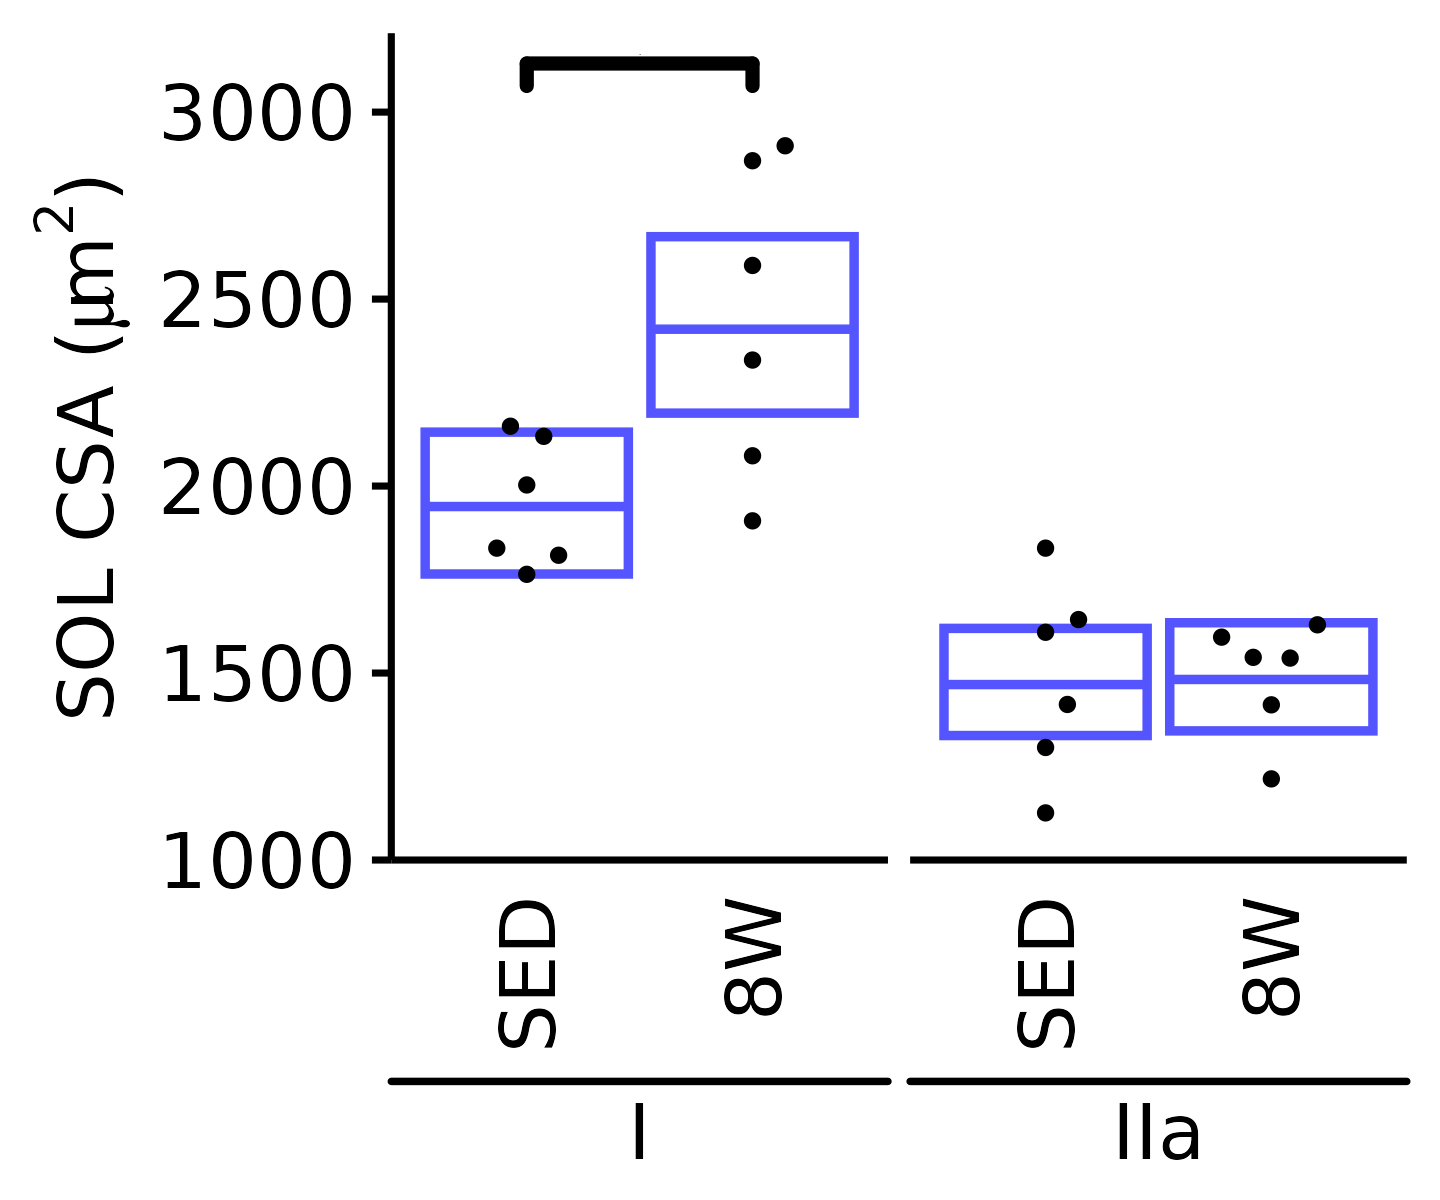
This article generates plots of fiber-type-specific cross-sectional
area. A bracket indicates a significant difference (Holm-adjusted
p-value < 0.05) between the means of the SED and 8W groups. Please
refer to the “Statistical analysis of mean fiber area by muscle and
fiber type” vignette for code to generate
FIBER_AREA_STATS.
# Confidence intervals for the means of each group
conf_df <- FIBER_AREA_EMM %>%
  summary() %>%
  as.data.frame() %>%
  # Rename columns to work with plot_fiber_type
  rename(any_of(c(lower.CL = "asymp.LCL",
                  upper.CL = "asymp.UCL",
                  response_mean = "response",
                  response_mean = "rate"))) %>%
  separate(col = muscle_type, into = c("muscle", "type"), sep = "\\.") %>%
  mutate(response = "Mean Fiber Area") # same as FIBER_AREA_STATS
LG
6M Female
plot_fiber_type(x = FIBER_TYPES,
                response = "fiber_area",
                age = "6M", sex = "Female", muscle = "LG",
                conf = filter(conf_df, response == "Mean Fiber Area"),
                stats = filter(FIBER_AREA_STATS,
                               response == "Mean Fiber Area"),
                ymin = 500, ymax = 3300) +
  scale_y_continuous(name = TeX("LG CSA ($\\mu m^2$)"),
                     breaks = seq(500, 3000, 500),
                     expand = expansion(mult = 5e-3))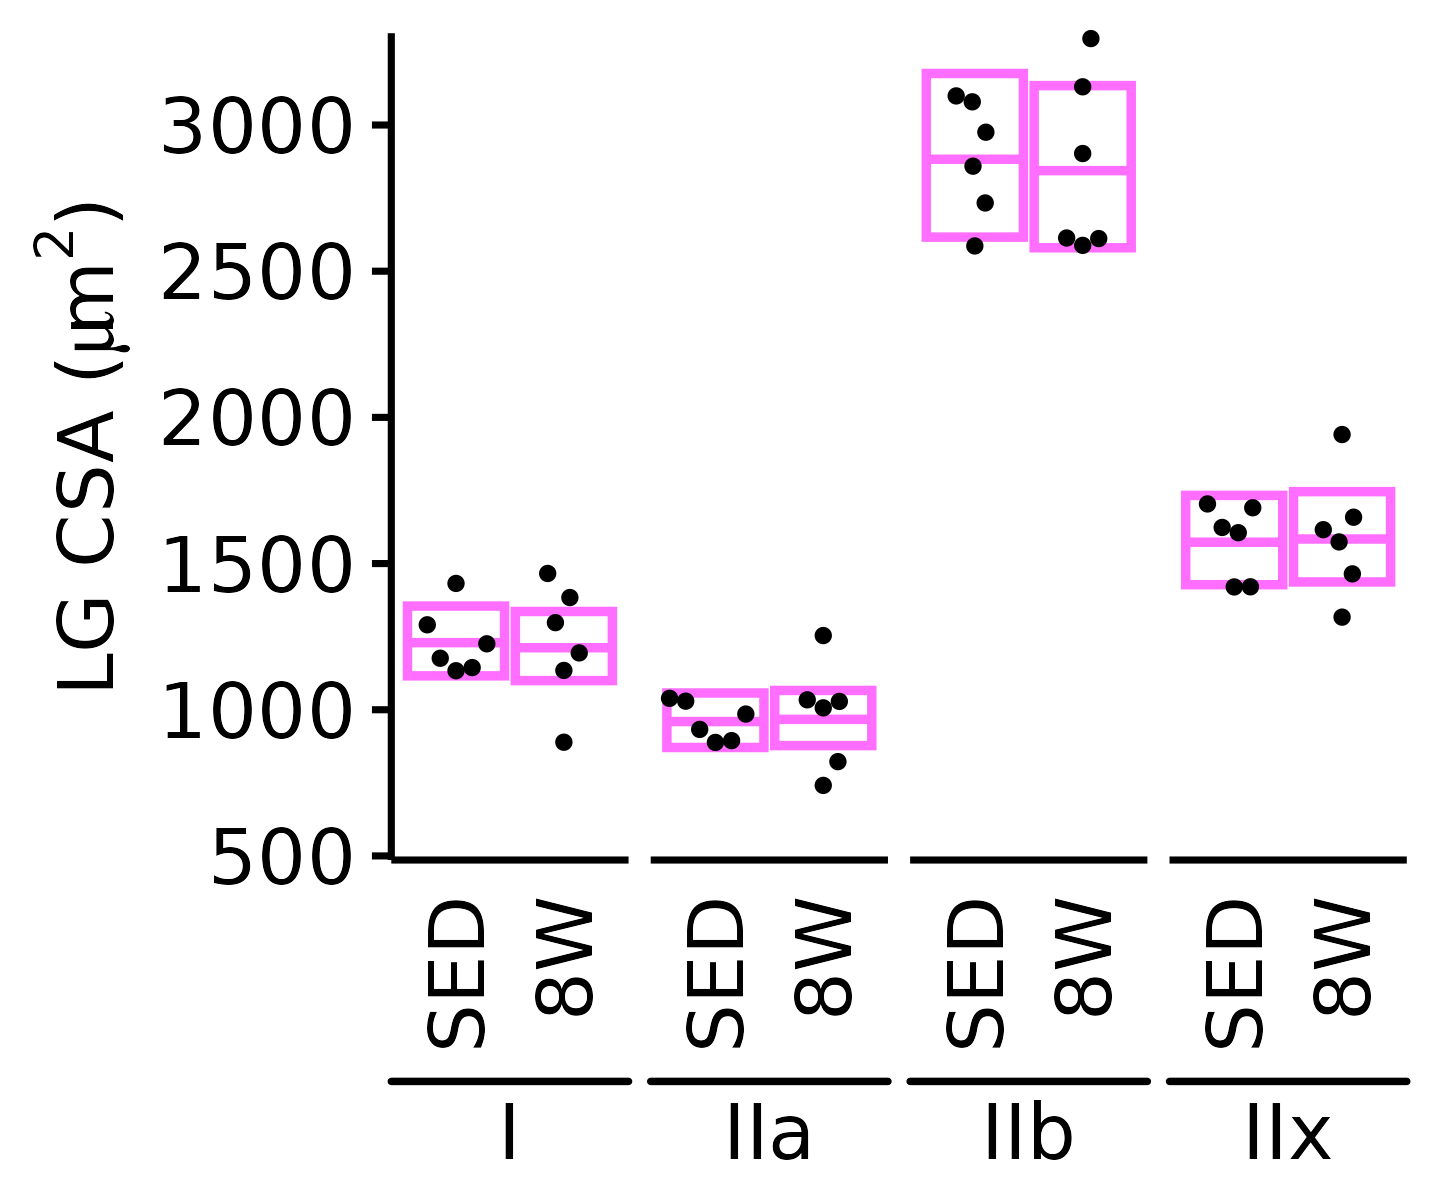
6M Male
plot_fiber_type(x = FIBER_TYPES,
                response = "fiber_area",
                age = "6M", sex = "Male", muscle = "LG",
                conf = filter(conf_df, response == "Mean Fiber Area"),
                stats = filter(FIBER_AREA_STATS,
                               response == "Mean Fiber Area"),
                ymin = 1000, ymax = 5000) +
  scale_y_continuous(name = TeX("LG CSA ($\\mu m^2$)"),
                     breaks = 1000 * 1:5,
                     expand = expansion(mult = c(0, 5e-3)))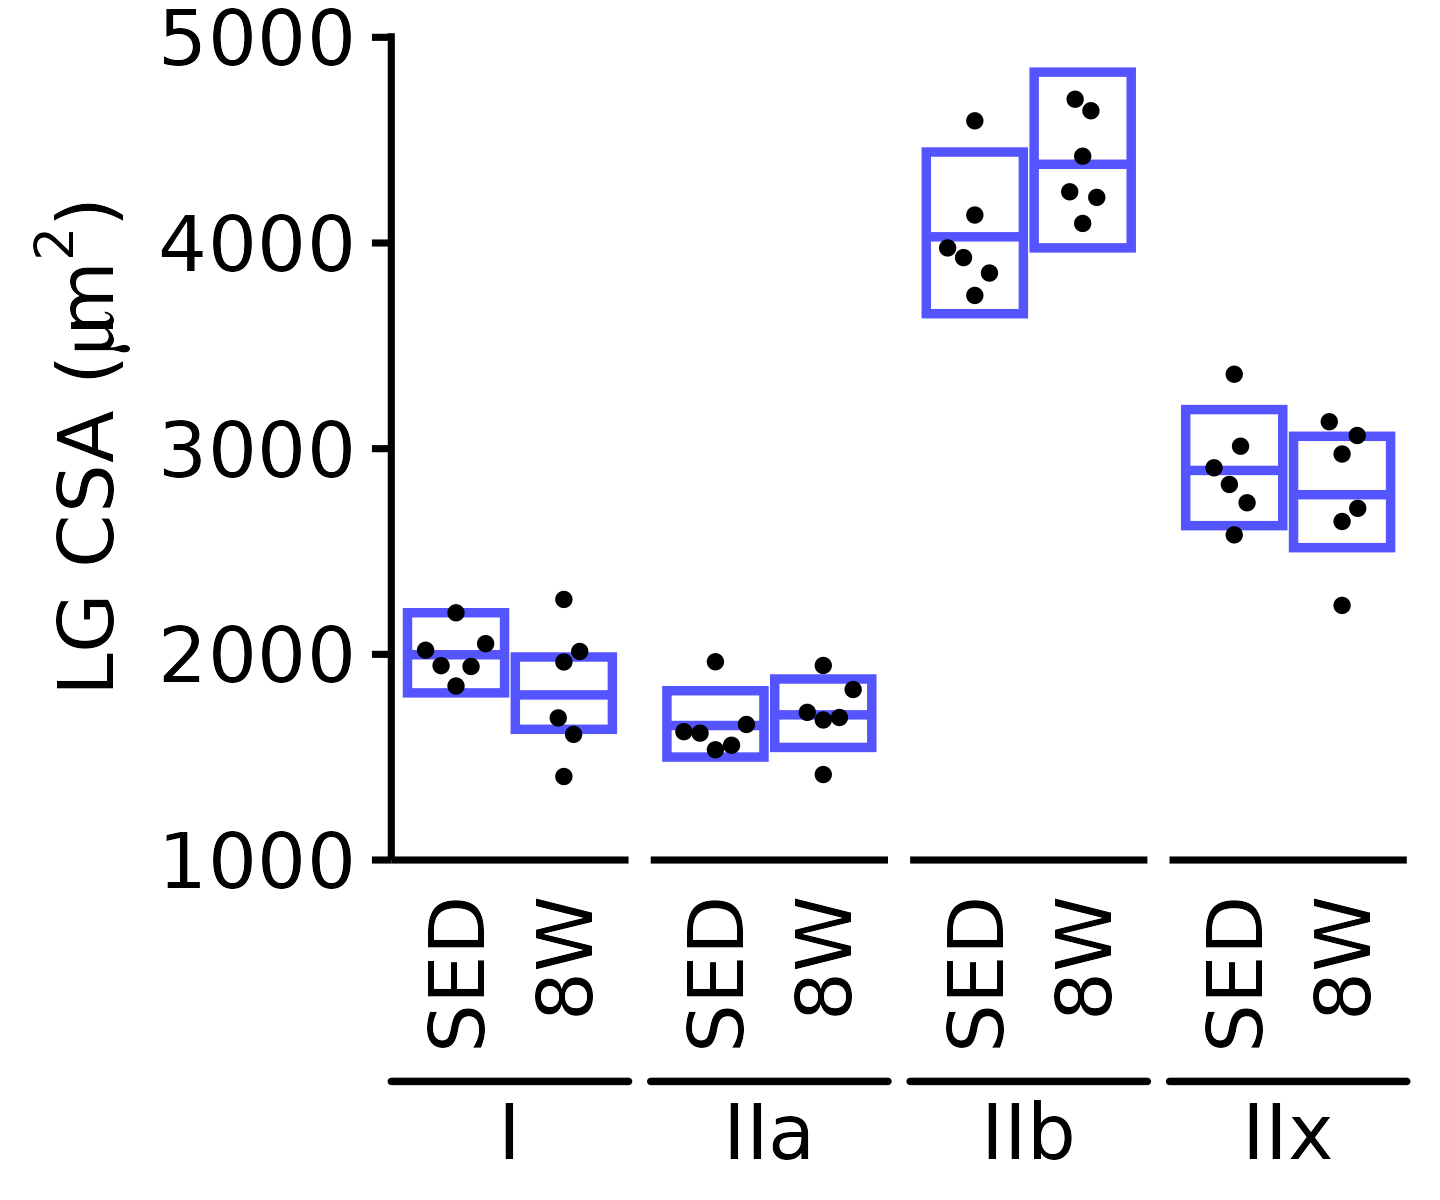
18M Female
plot_fiber_type(x = FIBER_TYPES,
                response = "fiber_area",
                age = "18M", sex = "Female", muscle = "LG",
                conf = filter(conf_df, response == "Mean Fiber Area"),
                stats = filter(FIBER_AREA_STATS, response == "Mean Fiber Area"),
                ymin = 1000, ymax = 3500) +
  scale_y_continuous(name = TeX("LG CSA ($\\mu m^2$)"),
                     breaks = seq(1000, 3500, 500),
                     expand = expansion(mult = c(0, 5e-3)))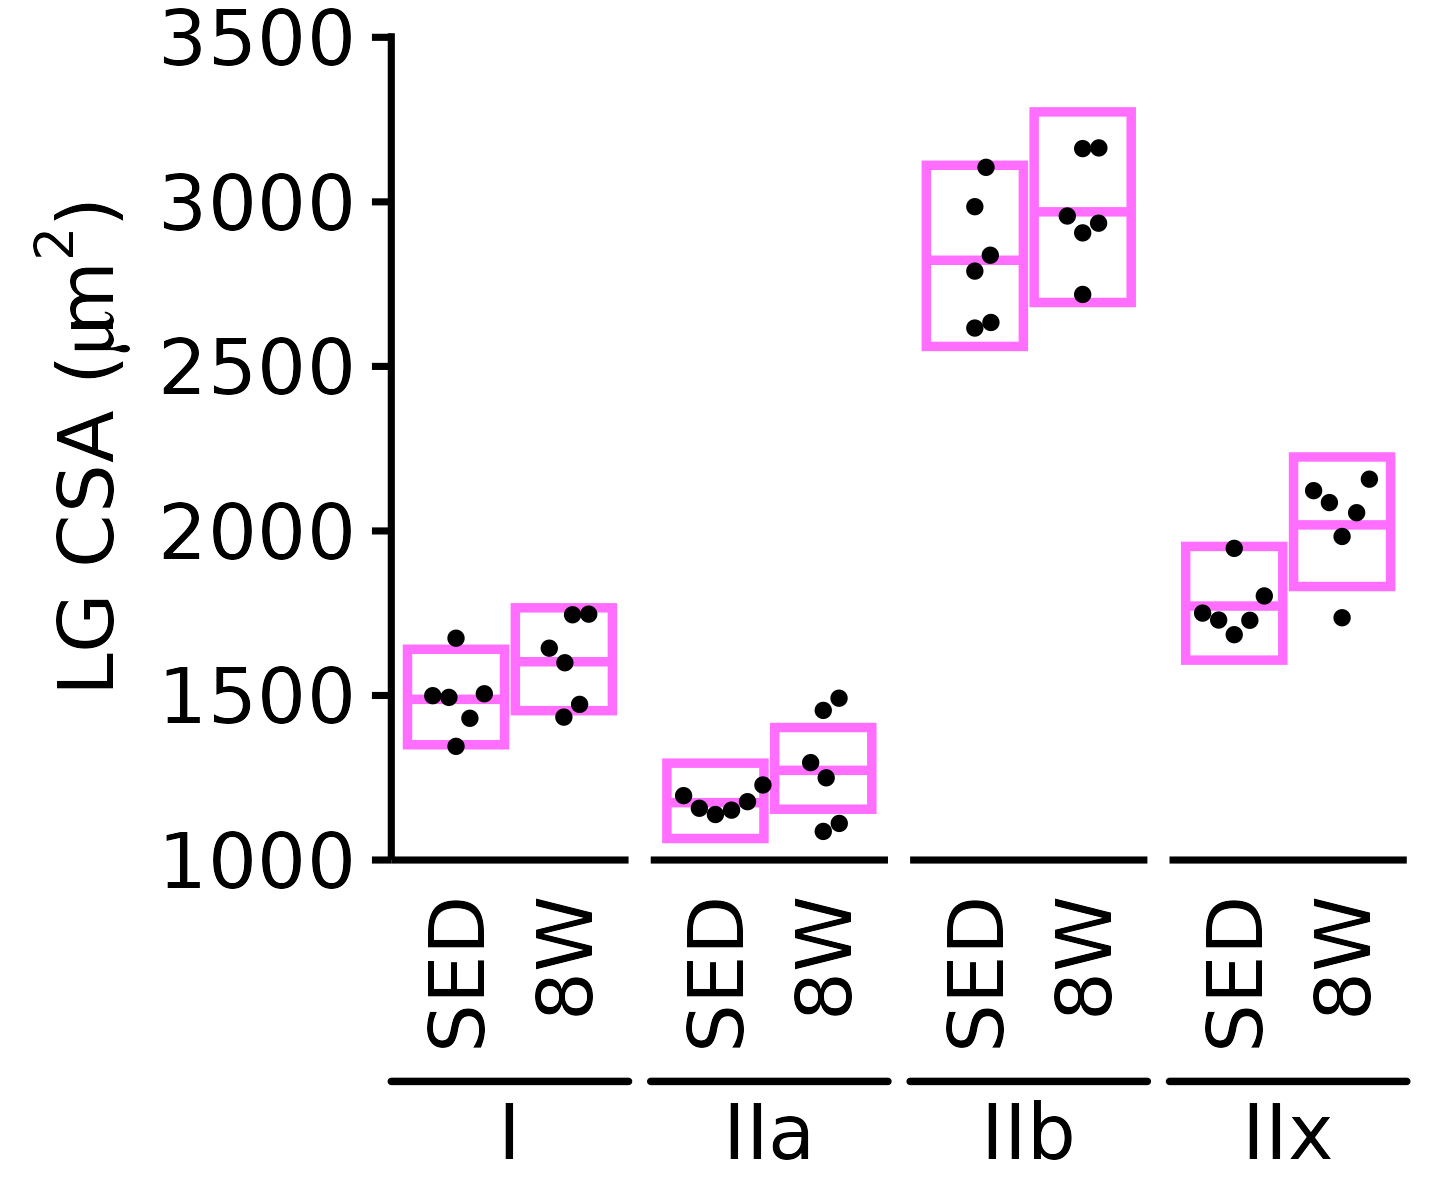
18M Male
plot_fiber_type(x = FIBER_TYPES,
                response = "fiber_area",
                age = "18M", sex = "Male", muscle = "LG",
                conf = filter(conf_df, response == "Mean Fiber Area"),
                stats = filter(FIBER_AREA_STATS, response == "Mean Fiber Area"),
                ymin = 1000, ymax = 4000) +
  scale_y_continuous(name = TeX("LG CSA ($\\mu m^2$)"),
                     breaks = 1000 * 1:4,
                     expand = expansion(mult = c(0, 5e-3)))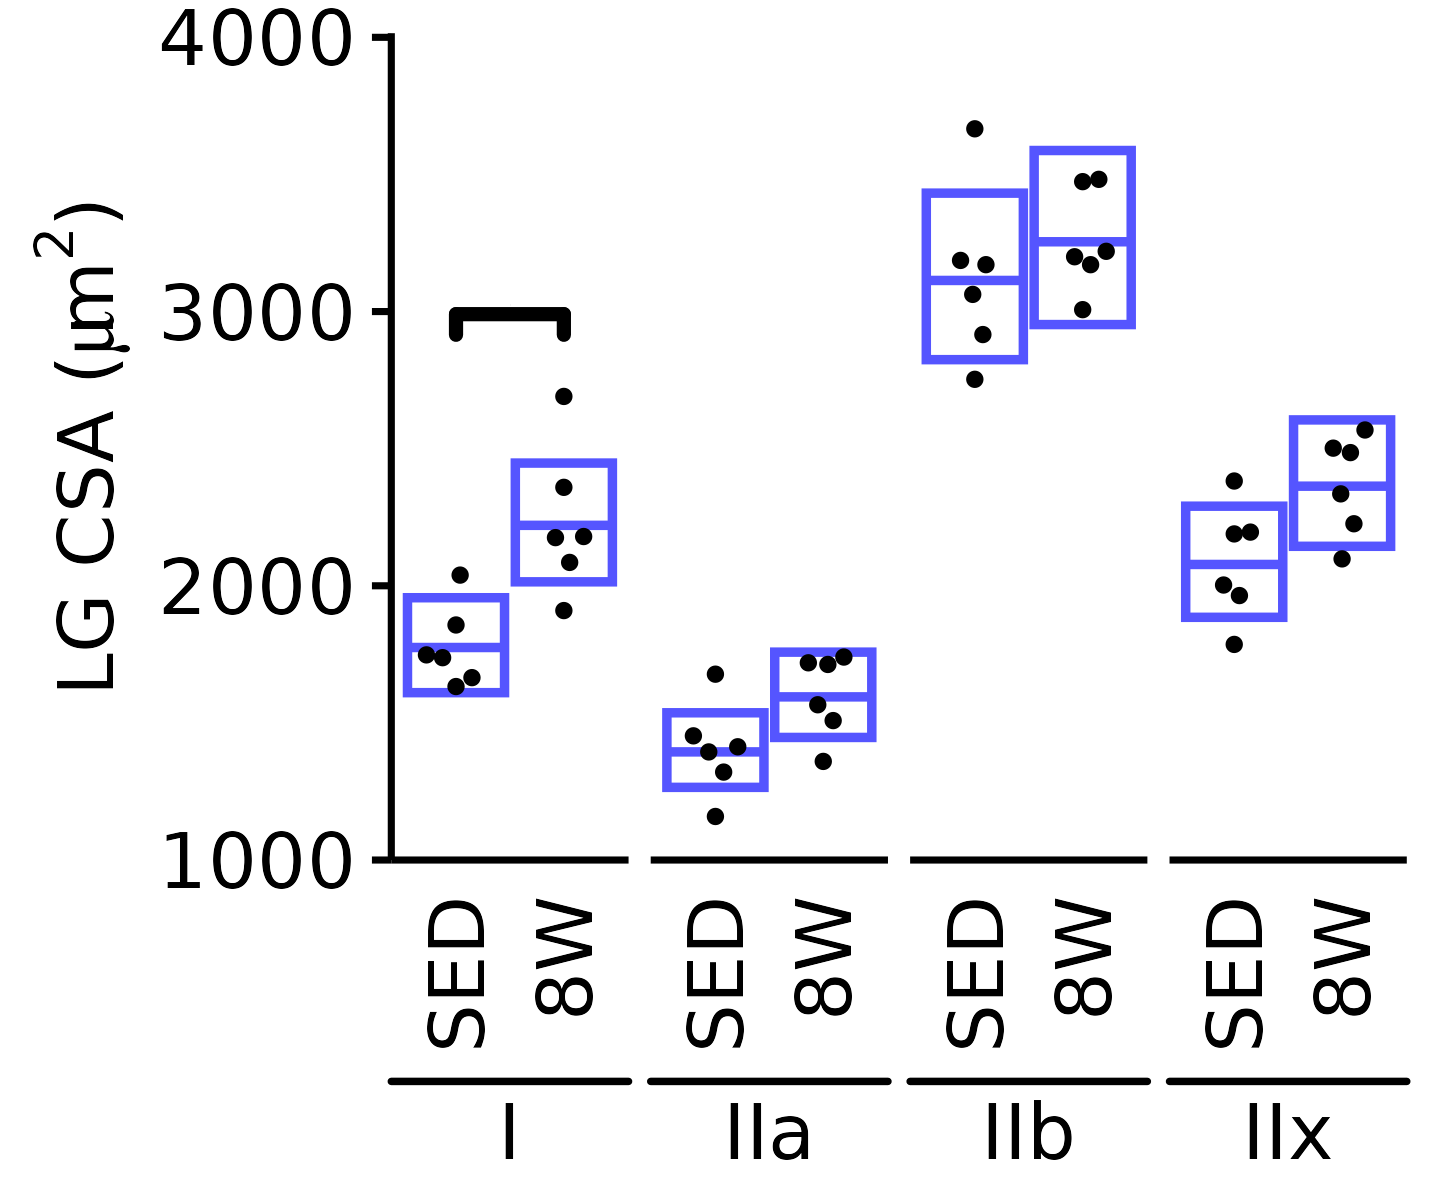
MG
6M Female
plot_fiber_type(x = FIBER_TYPES,
                response = "fiber_area",
                age = "6M", sex = "Female", muscle = "MG",
                conf = filter(conf_df, response == "Mean Fiber Area"),
                stats = filter(FIBER_AREA_STATS, response == "Mean Fiber Area"),
                ymin = 700, ymax = 3200) +
  scale_y_continuous(name = TeX("MG CSA ($\\mu m^2$)"),
                     breaks = seq(1000, 3000, 500),
                     expand = expansion(mult = c(0, 5e-3)))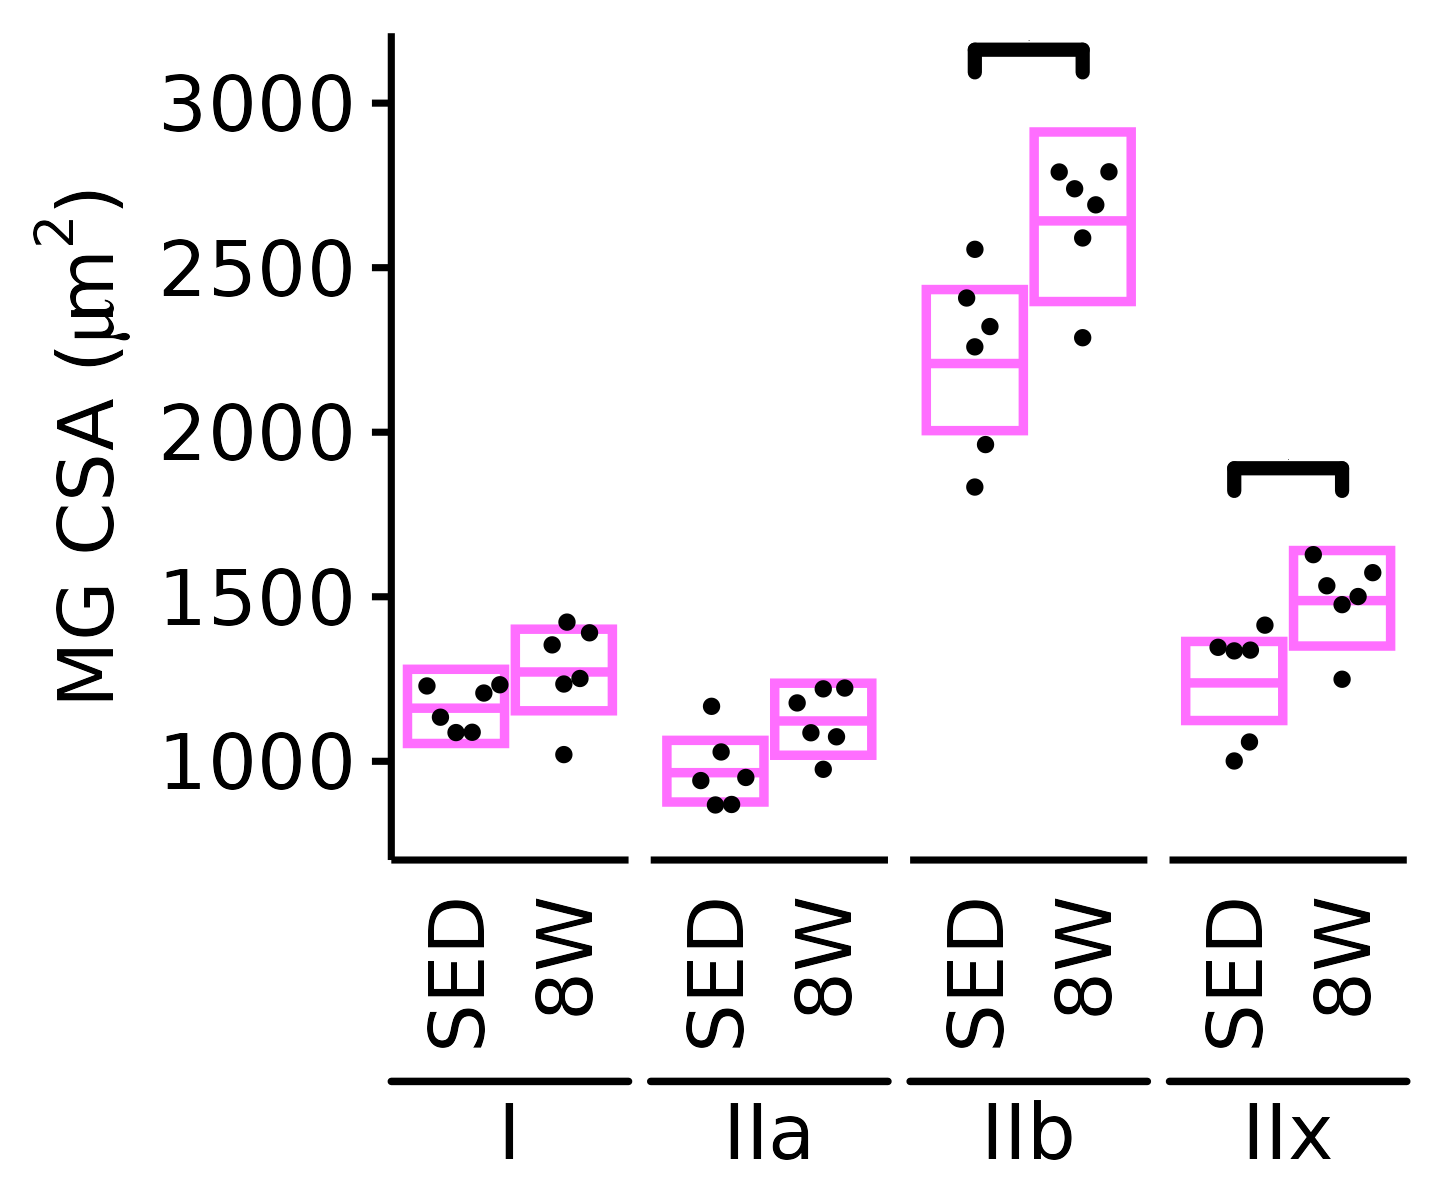
6M Male
plot_fiber_type(x = FIBER_TYPES,
                response = "fiber_area",
                age = "6M", sex = "Male", muscle = "MG",
                conf = filter(conf_df, response == "Mean Fiber Area"),
                stats = filter(FIBER_AREA_STATS,
                               response == "Mean Fiber Area"),
                ymin = 1000, ymax = 5000) +
  scale_y_continuous(name = TeX("MG CSA ($\\mu m^2$)"),
                     breaks = 1000 * 1:5,
                     expand = expansion(mult = c(0, 5e-3)))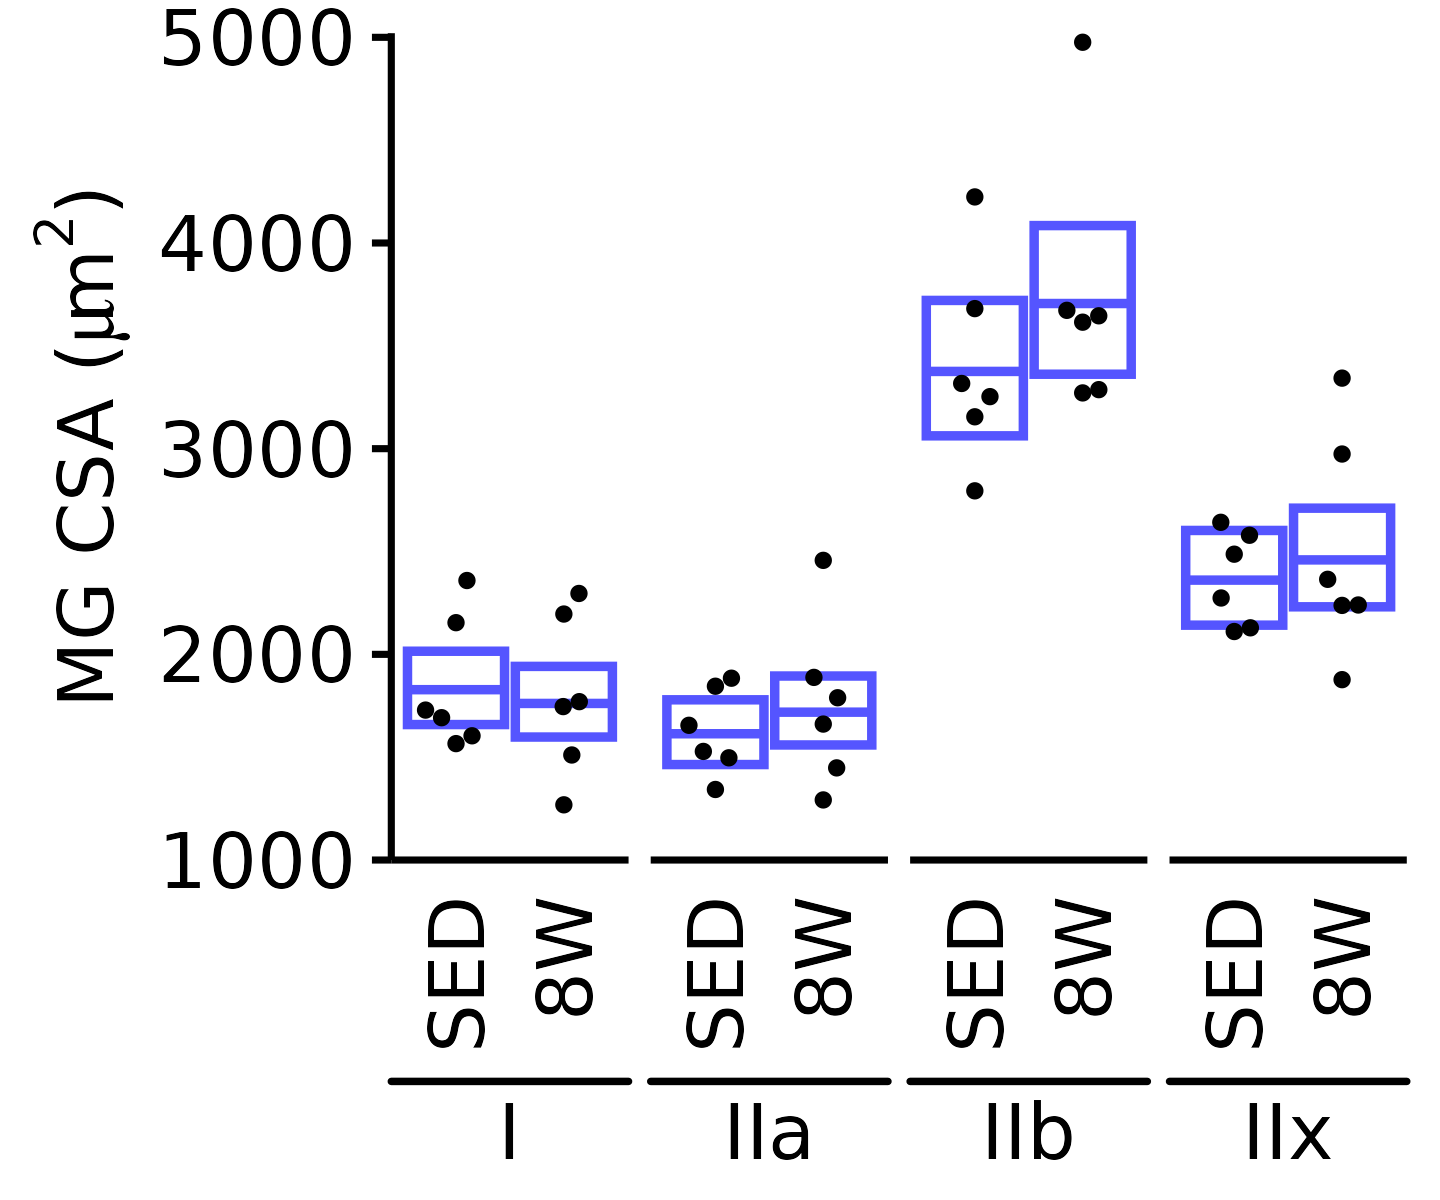
18M Female
plot_fiber_type(x = FIBER_TYPES,
                response = "fiber_area",
                age = "18M", sex = "Female", muscle = "MG",
                conf = filter(conf_df, response == "Mean Fiber Area"),
                stats = filter(FIBER_AREA_STATS, response == "Mean Fiber Area"),
                ymin = 1000, ymax = 3200) +
  scale_y_continuous(name = TeX("MG CSA ($\\mu m^2$)"),
                     breaks = seq(1000, 3000, 500),
                     expand = expansion(mult = c(0, 5e-3)))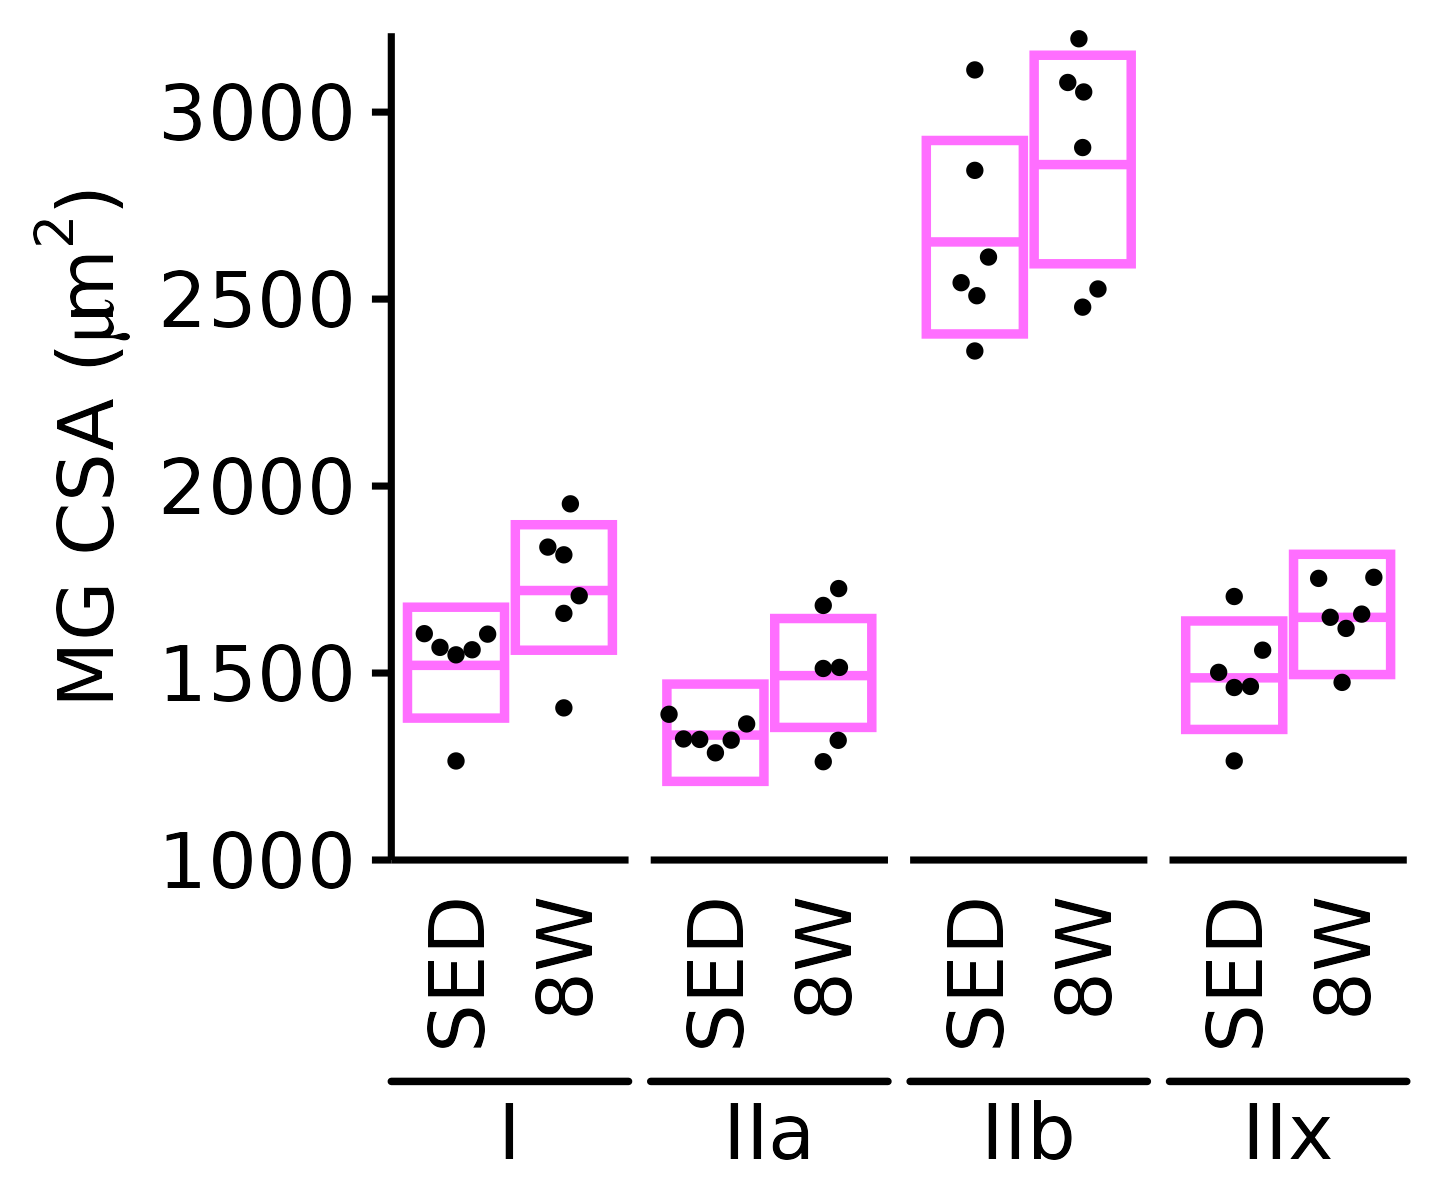
18M Male
plot_fiber_type(x = FIBER_TYPES,
                response = "fiber_area",
                age = "18M", sex = "Male", muscle = "MG",
                conf = filter(conf_df, response == "Mean Fiber Area"),
                stats = filter(FIBER_AREA_STATS, response == "Mean Fiber Area"),
                ymin = 1000, ymax = 3600) +
  scale_y_continuous(name = TeX("MG CSA ($\\mu m^2$)"),
                     breaks = seq(1000, 3500, 500),
                     expand = expansion(mult = c(0, 5e-3)))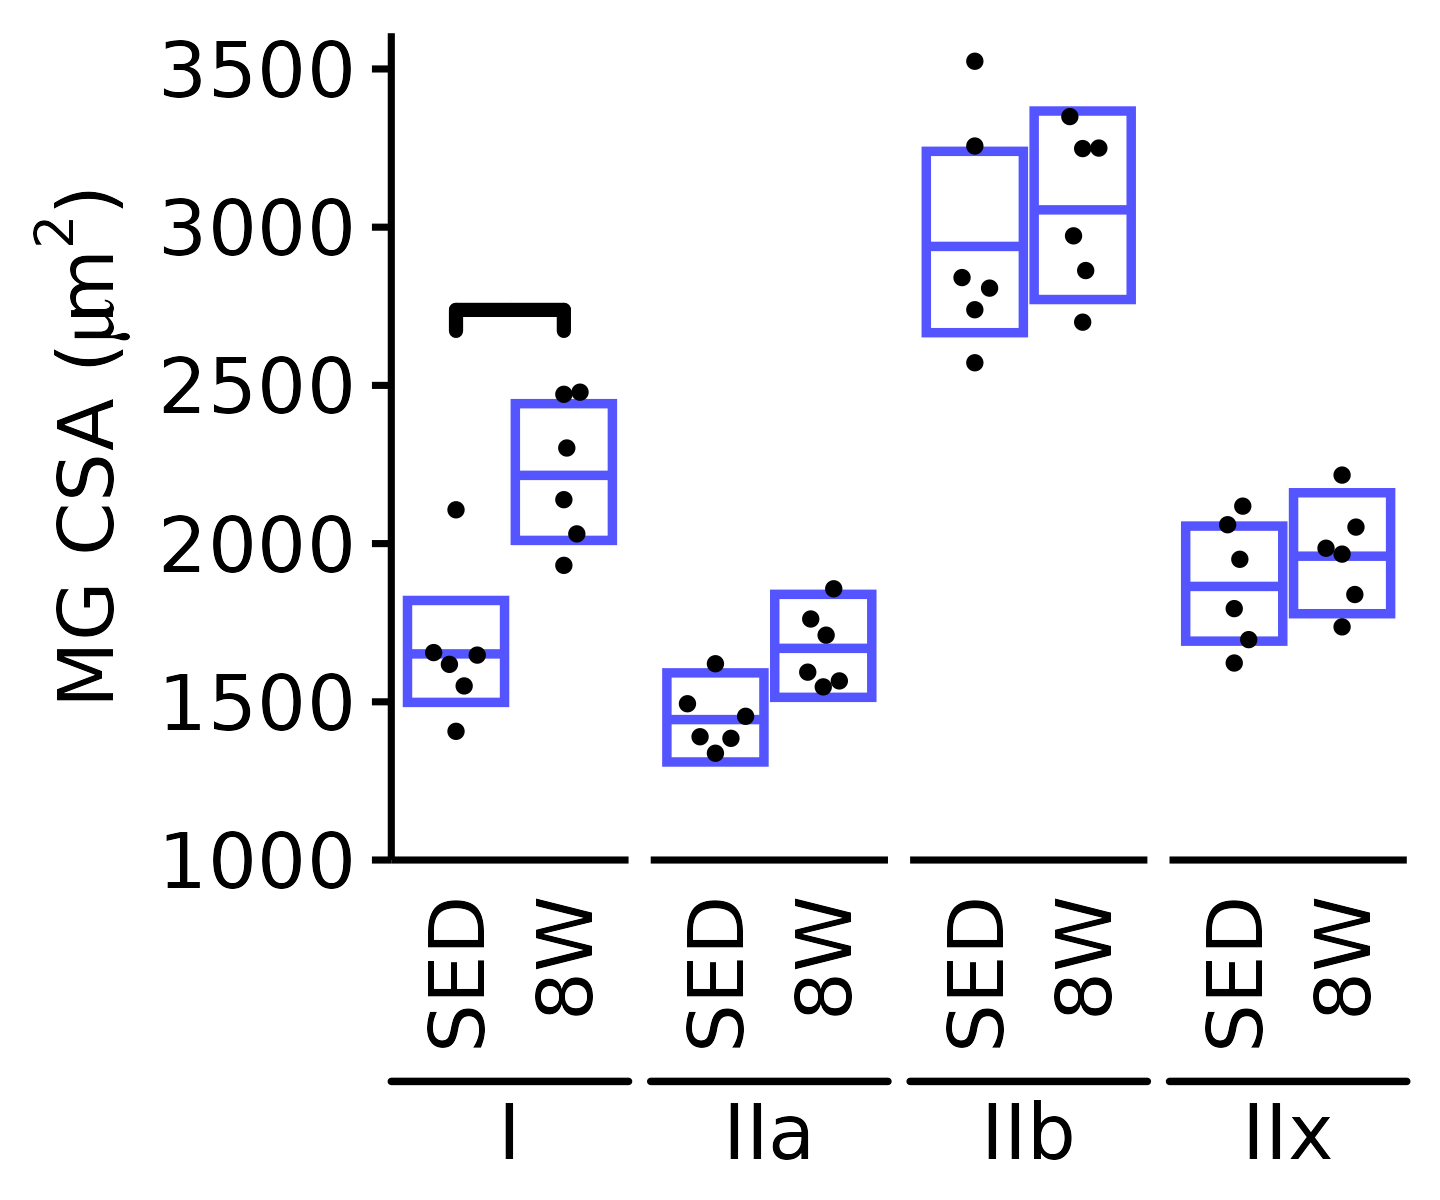
PL
6M Female
plot_fiber_type(x = FIBER_TYPES,
                response = "fiber_area",
                age = "6M", sex = "Female", muscle = "PL",
                conf = filter(conf_df, response == "Mean Fiber Area"),
                stats = filter(FIBER_AREA_STATS, response == "Mean Fiber Area"),
                ymin = 500, ymax = 2700) +
  scale_y_continuous(name = TeX("PL CSA ($\\mu m^2$)"),
                     breaks = seq(500, 2500, 500),
                     expand = expansion(mult = c(0, 5e-3)))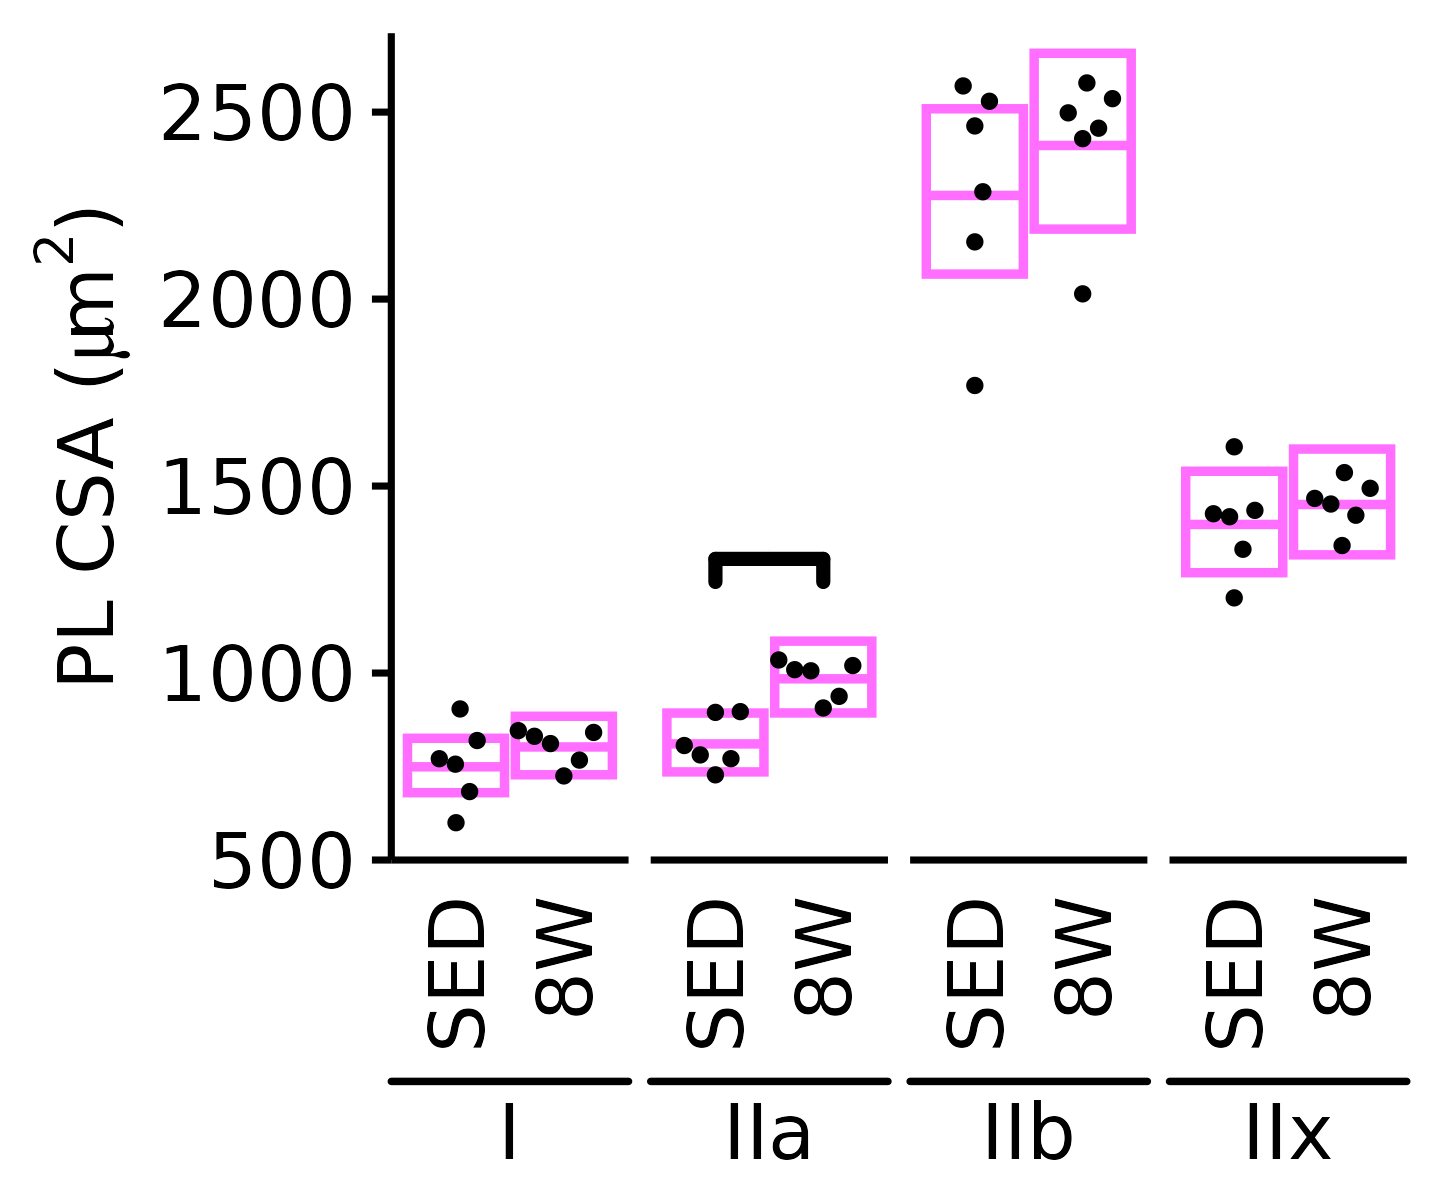
6M Male
plot_fiber_type(x = FIBER_TYPES,
                response = "fiber_area",
                age = "6M", sex = "Male", muscle = "PL",
                conf = filter(conf_df, response == "Mean Fiber Area"),
                stats = filter(FIBER_AREA_STATS,
                               response == "Mean Fiber Area"),
                ymin = 700, ymax = 5000) +
  scale_y_continuous(name = TeX("PL CSA ($\\mu m^2$)"),
                     breaks = 1000 * 1:5,
                     expand = expansion(mult = c(0, 5e-3)))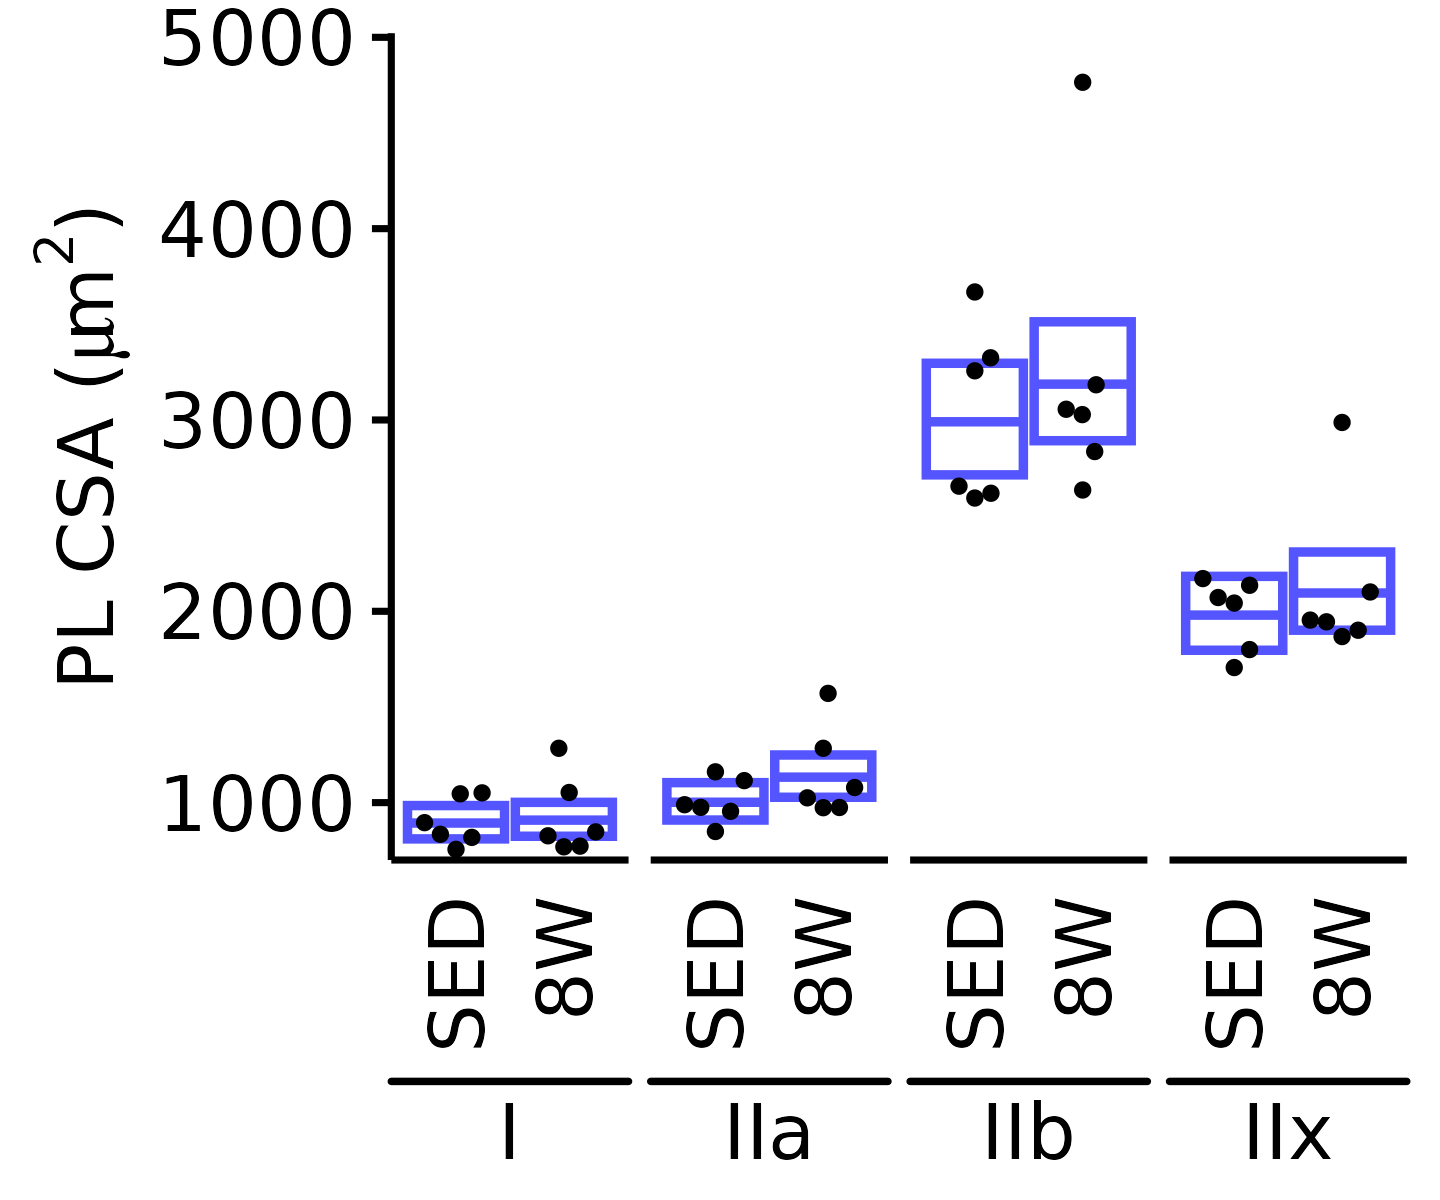
18M Female
plot_fiber_type(x = FIBER_TYPES,
                response = "fiber_area",
                age = "18M", sex = "Female", muscle = "PL",
                conf = filter(conf_df, response == "Mean Fiber Area"),
                stats = filter(FIBER_AREA_STATS, response == "Mean Fiber Area"),
                ymin = 750, ymax = 3200) +
  scale_y_continuous(name = TeX("PL CSA ($\\mu m^2$)"),
                     breaks = seq(1000, 3000, 500),
                     expand = expansion(mult = c(0, 5e-3)))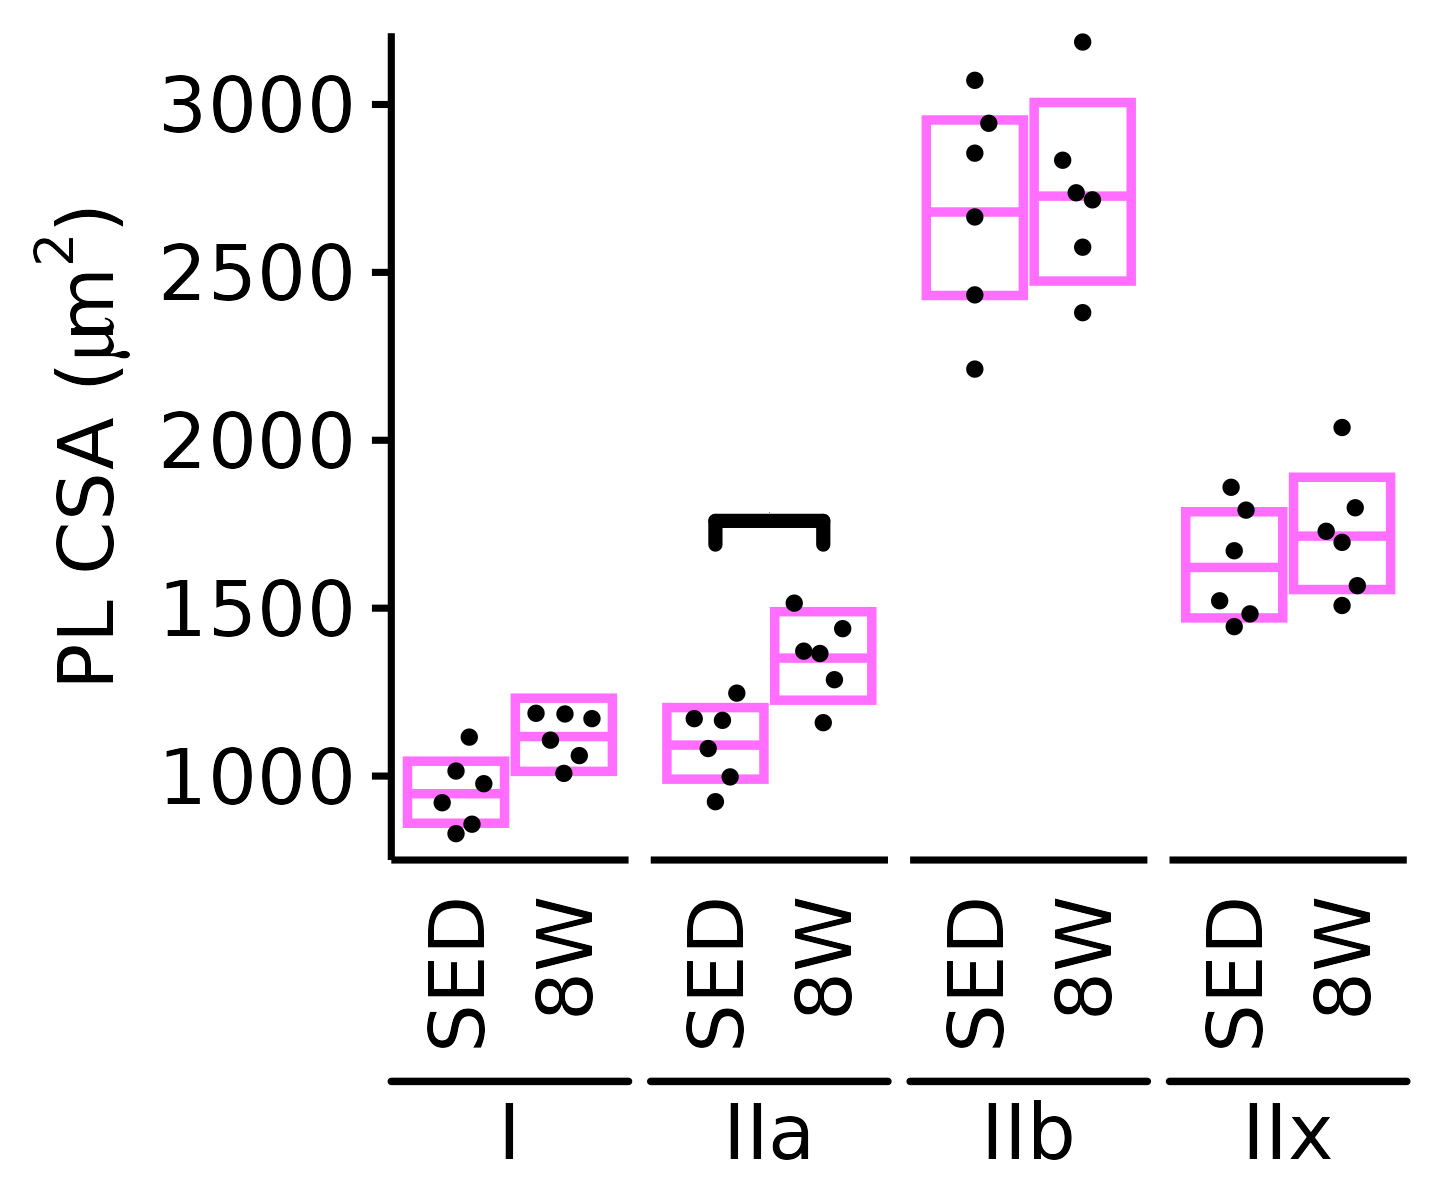
18M Male
plot_fiber_type(x = FIBER_TYPES,
                response = "fiber_area",
                age = "18M", sex = "Male", muscle = "PL",
                conf = filter(conf_df, response == "Mean Fiber Area"),
                stats = filter(FIBER_AREA_STATS, response == "Mean Fiber Area"),
                ymin = 750, ymax = 4050) +
  scale_y_continuous(name = TeX("PL CSA ($\\mu m^2$)"),
                     breaks = 1000 * 1:4,
                     expand = expansion(mult = c(0, 5e-3)))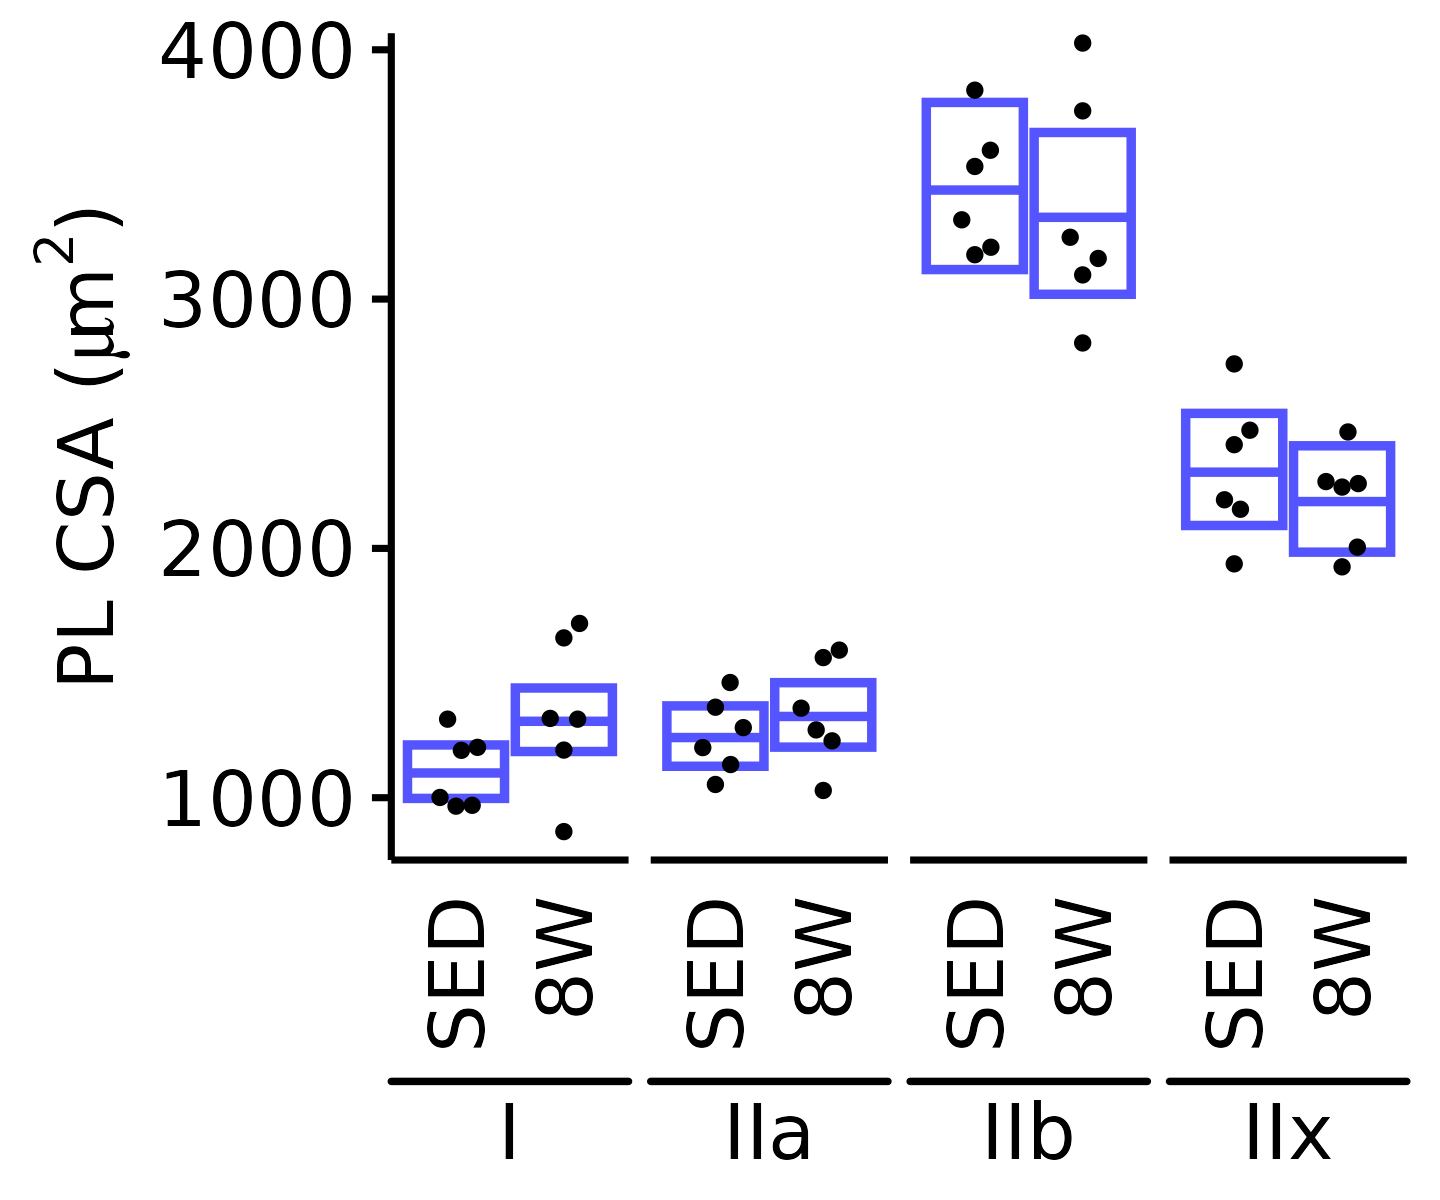
SOL
6M Female
plot_fiber_type(x = FIBER_TYPES,
                response = "fiber_area",
                age = "6M", sex = "Female", muscle = "SOL",
                conf = filter(conf_df, response == "Mean Fiber Area"),
                stats = filter(FIBER_AREA_STATS, response == "Mean Fiber Area"),
                ymin = 750, ymax = 1900) +
  scale_y_continuous(name = TeX("SOL CSA ($\\mu m^2$)"),
                     breaks = seq(800, 1800, 200),
                     expand = expansion(mult = c(0, 5e-3)))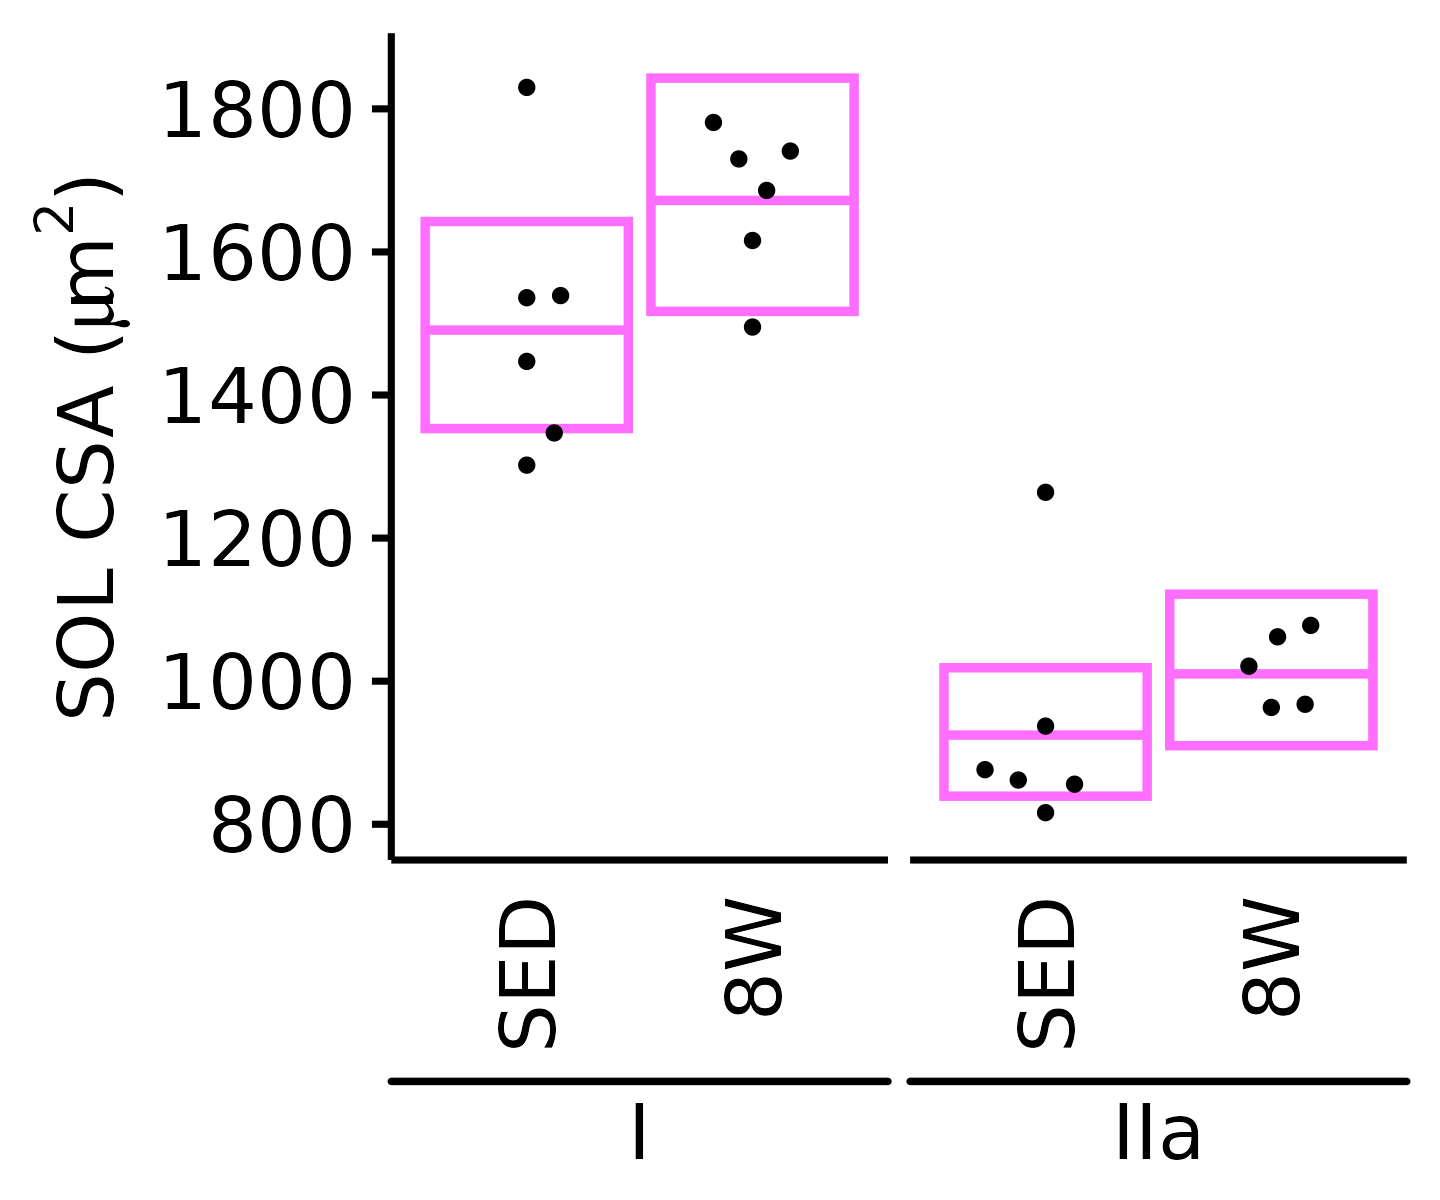
6M Male
plot_fiber_type(x = FIBER_TYPES,
                response = "fiber_area",
                age = "6M", sex = "Male", muscle = "SOL",
                conf = filter(conf_df, response == "Mean Fiber Area"),
                stats = filter(FIBER_AREA_STATS,
                               response == "Mean Fiber Area"),
                ymin = 1200, ymax = 2200) +
  scale_y_continuous(name = TeX("SOL CSA ($\\mu m^2$)"),
                     breaks = seq(1200, 2200, 200),
                     expand = expansion(mult = c(0, 5e-3)))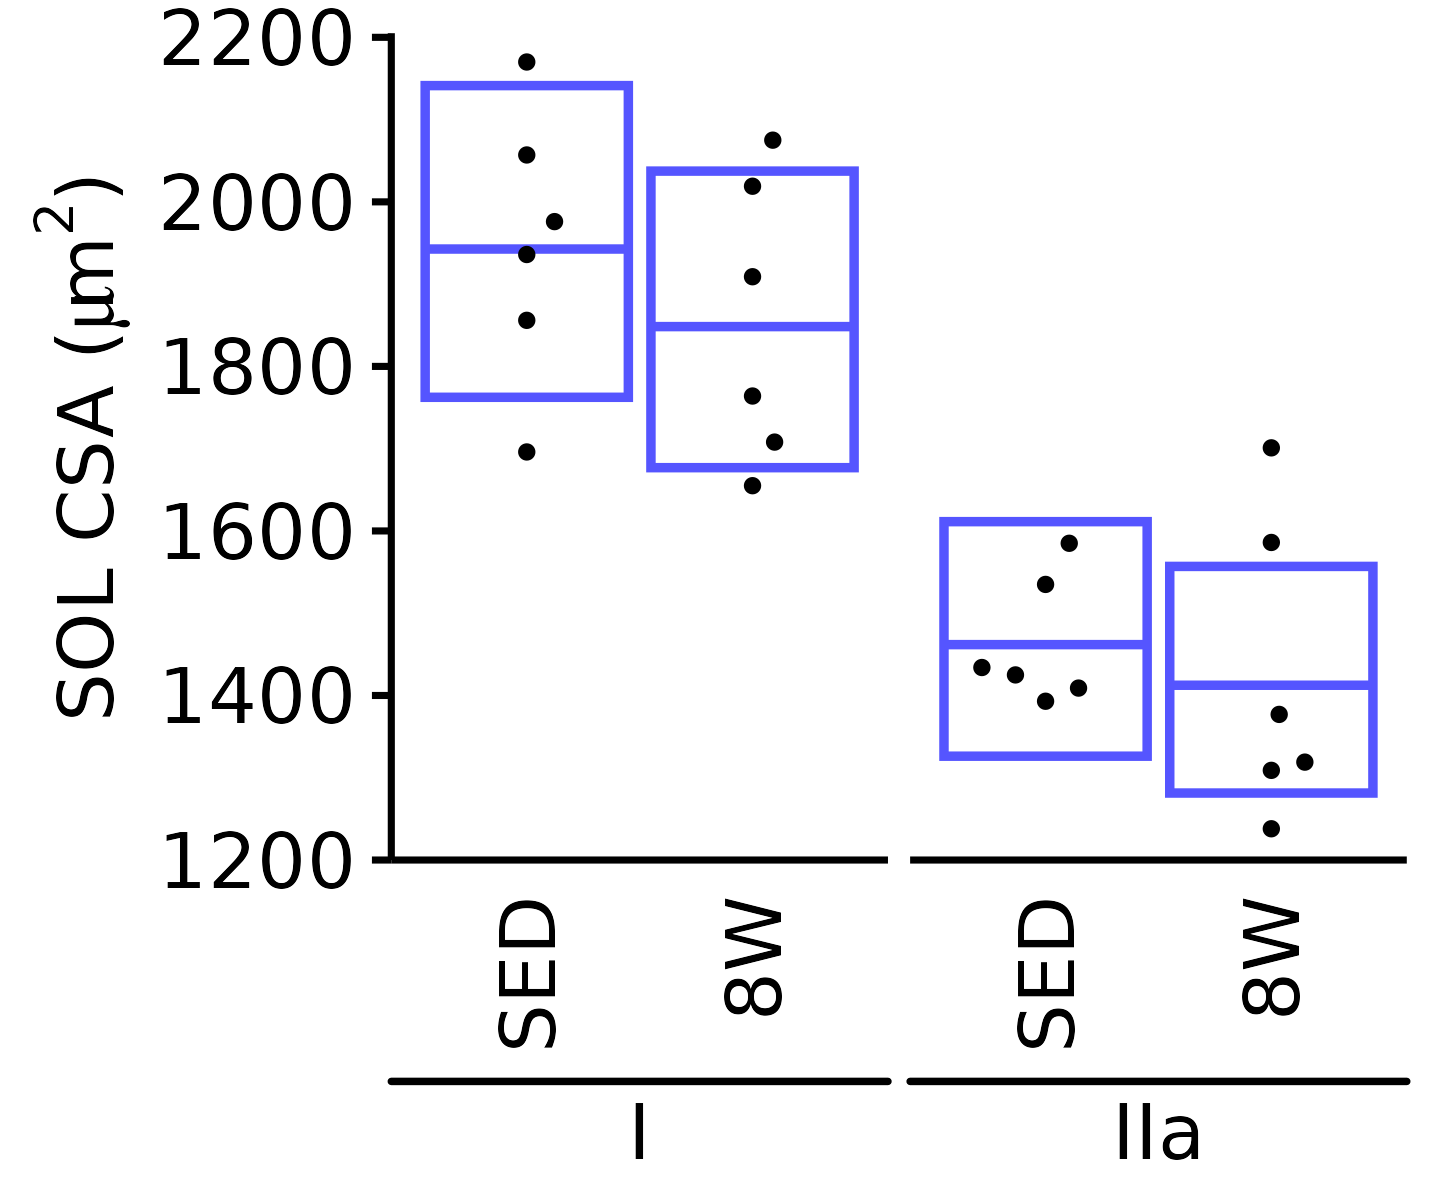
18M Female
plot_fiber_type(x = FIBER_TYPES,
                response = "fiber_area",
                age = "18M", sex = "Female", muscle = "SOL",
                conf = filter(conf_df, response == "Mean Fiber Area"),
                stats = filter(FIBER_AREA_STATS, response == "Mean Fiber Area"),
                ymin = 750, ymax = 2000) +
  scale_y_continuous(name = TeX("SOL CSA ($\\mu m^2$)"),
                     breaks = seq(800, 2000, 200),
                     expand = expansion(mult = c(0, 5e-3)))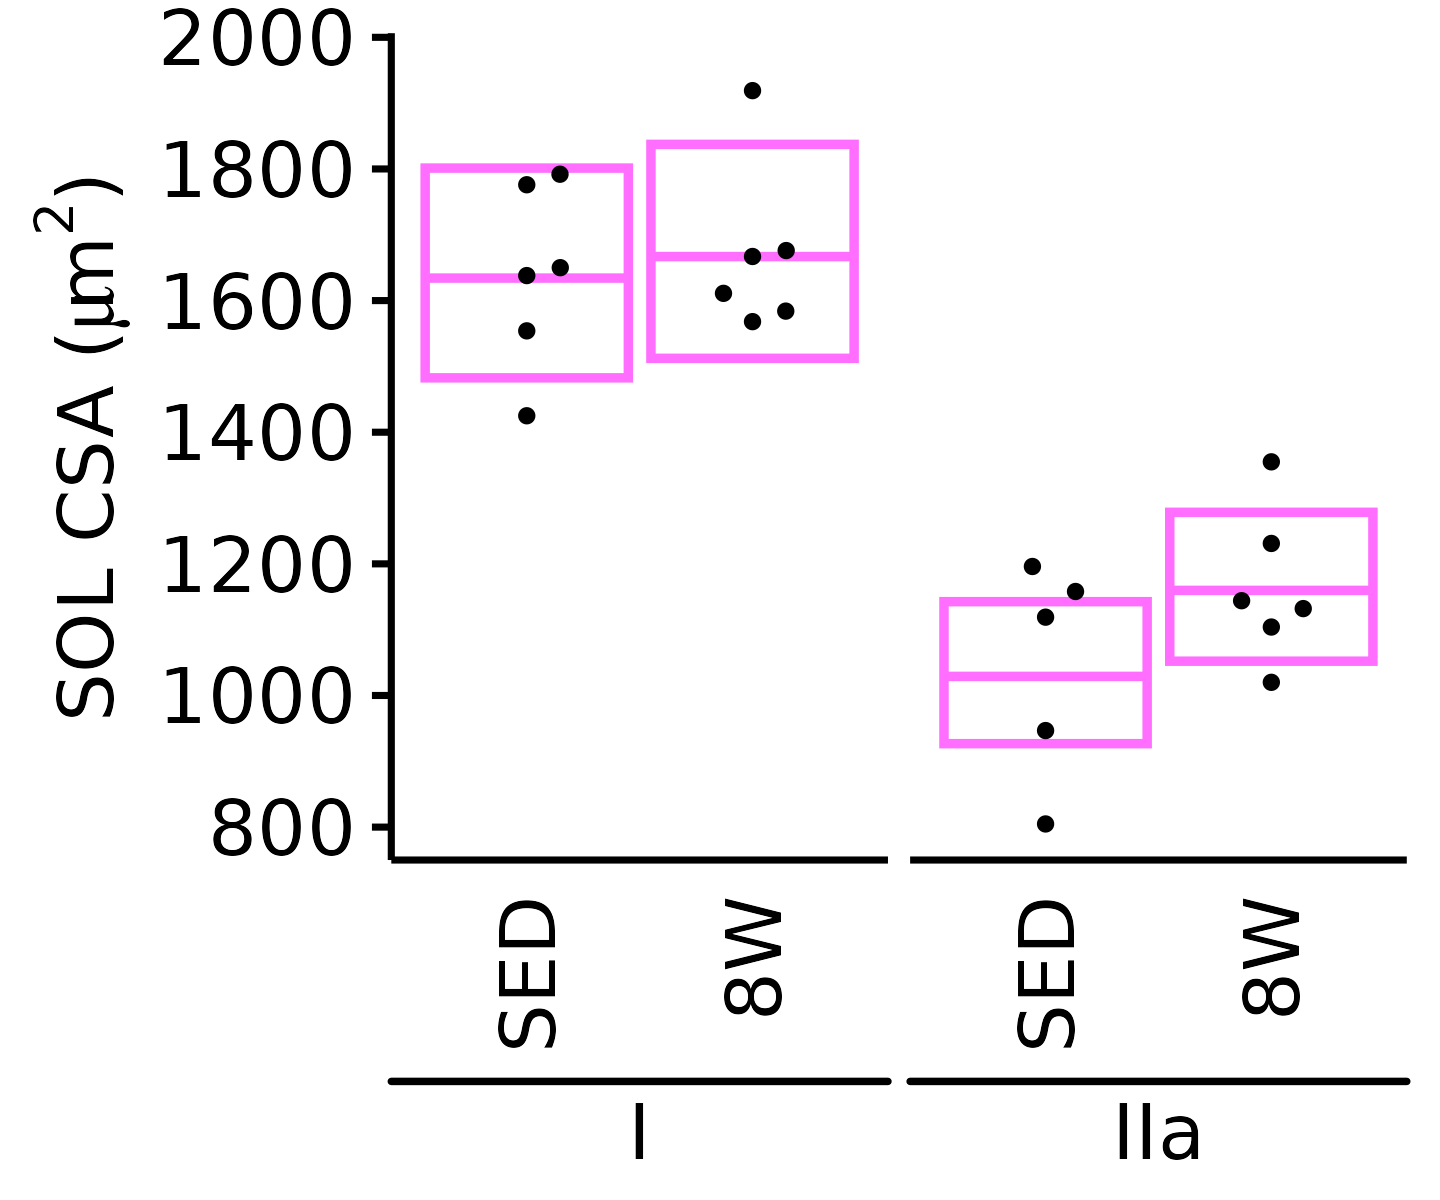
18M Male
plot_fiber_type(x = FIBER_TYPES,
                response = "fiber_area",
                age = "18M", sex = "Male", muscle = "SOL",
                conf = filter(conf_df, response == "Mean Fiber Area"),
                stats = filter(FIBER_AREA_STATS,
                               response == "Mean Fiber Area"),
                ymin = 1000, ymax = 3200) +
  scale_y_continuous(name = TeX("SOL CSA ($\\mu m^2$)"),
                     breaks = seq(1000, 3000, 500),
                     expand = expansion(mult = c(0, 5e-3)))