Plots of post- vs. pre-training body composition and VO2max testing measures
Tyler Sagendorf
01 May, 2024
Source:vignettes/articles/pre_post_plots.Rmd
pre_post_plots.Rmd
# Required packages
library(MotrpacRatTrainingPhysiologyData)
library(dplyr)
library(ggplot2)
library(ggbeeswarm)
library(ggh4x) # facet_nested_wrap
library(latex2exp)
Overview
This article generates all plots of pre- and post-training NMR body
composition and VO\(_2\)max testing
measures: body mass recorded on the NMR day, NMR lean mass, NMR fat
mass, NMR % lean mass, NMR % fat mass, absolute VO\(_2\)max, relative VO\(_2\)max, and maximum run speed. The line
segments span from the pre to post value of each sample, with red
indicating an increase, blue indicating a decrease, and a black point
indicating no change. An asterisk indicates the mean of the (post - pre)
differences is significantly different from zero (Holm-adjusted p-value
< 0.05), and the direction of change is determined by the majority
color (red or blue) of the line segments. Please refer to the
“Statistical analyses of post- vs. pre-training body composition and
VO2max testing measures” vignette for code to generate
PRE_POST_STATS.
NMR Body Mass
Body mass (g) recorded on the same day as the NMR body composition measures.
6M Female
# 6M Female NMR Body Mass
plot_pre_post(x = filter(NMR, age == "6M", sex == "Female"),
              pre = "pre_body_mass", post = "post_body_mass",
              stats = filter(PRE_POST_STATS, response == "NMR Body Mass",
                             age == "6M", sex == "Female"),
              ymin = 150, ymax = 240) +
  scale_y_continuous(name = "Body Mass (g)",
                     breaks = seq(150, 240, 15),
                     expand = expansion(mult = c(0, 5e-3)))
6M Male
# 6M Male NMR Body Mass
plot_pre_post(x = filter(NMR, age == "6M", sex == "Male"),
              pre = "pre_body_mass", post = "post_body_mass",
              stats = filter(PRE_POST_STATS, response == "NMR Body Mass",
                             age == "6M", sex == "Male"),
              ymin = 260, ymax = 410) +
  scale_y_continuous(name = "Body Mass (g)",
                     breaks = seq(260, 410, 25),
                     expand = expansion(mult = c(0, 5e-3)))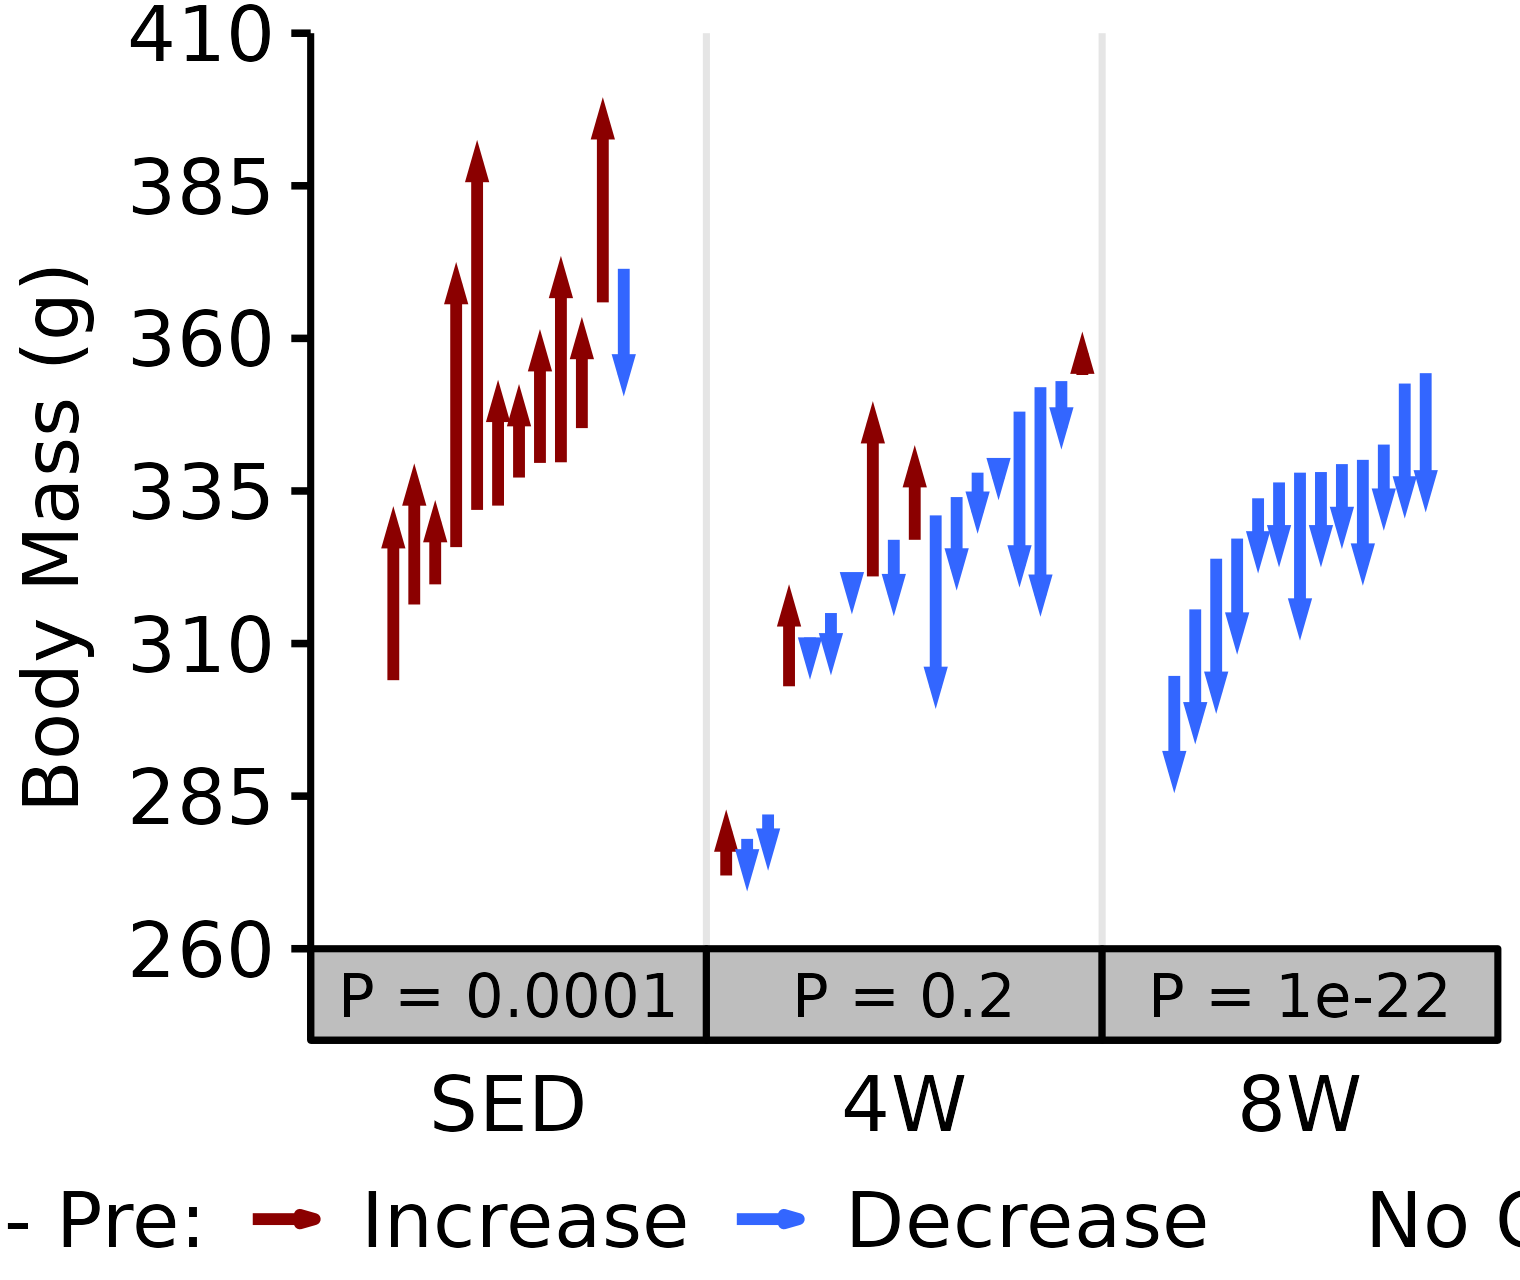
18M Female
# 18M Female NMR Body Mass
plot_pre_post(x = filter(NMR, age == "18M", sex == "Female"),
              pre = "pre_body_mass", post = "post_body_mass",
              stats = filter(PRE_POST_STATS, response == "NMR Body Mass",
                             age == "18M", sex == "Female"),
              ymin = 200, ymax = 280) +
  scale_y_continuous(name = "Body Mass (g)",
                     breaks = seq(200, 280, 20),
                     expand = expansion(mult = c(0, 5e-3)))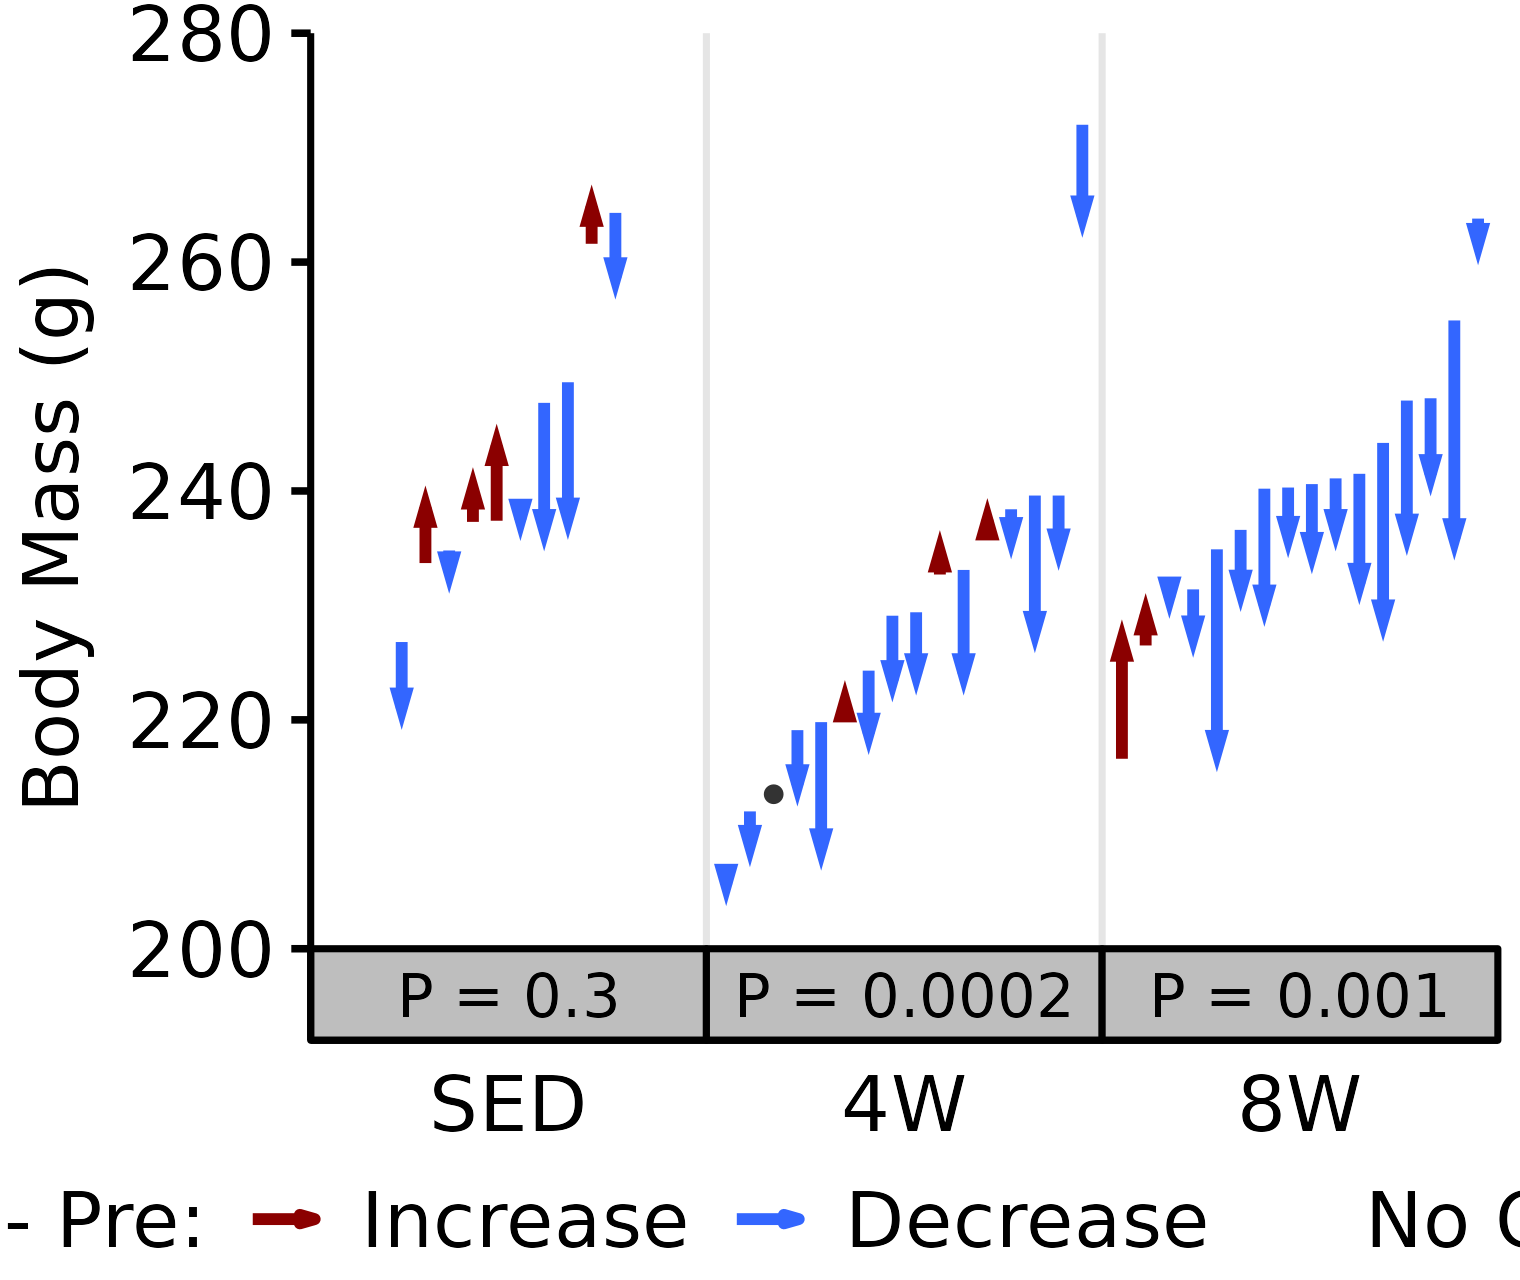
18M Male
# 18M Male NMR Body Mass
plot_pre_post(x = filter(NMR, age == "18M", sex == "Male"),
              pre = "pre_body_mass", post = "post_body_mass",
              stats = filter(PRE_POST_STATS, response == "NMR Body Mass",
                             age == "18M", sex == "Male"),
              ymin = 345, ymax = 485) +
  scale_y_continuous(name = "Body Mass (g)",
                     breaks = seq(345, 485, 20),
                     expand = expansion(mult = c(0, 5e-3)))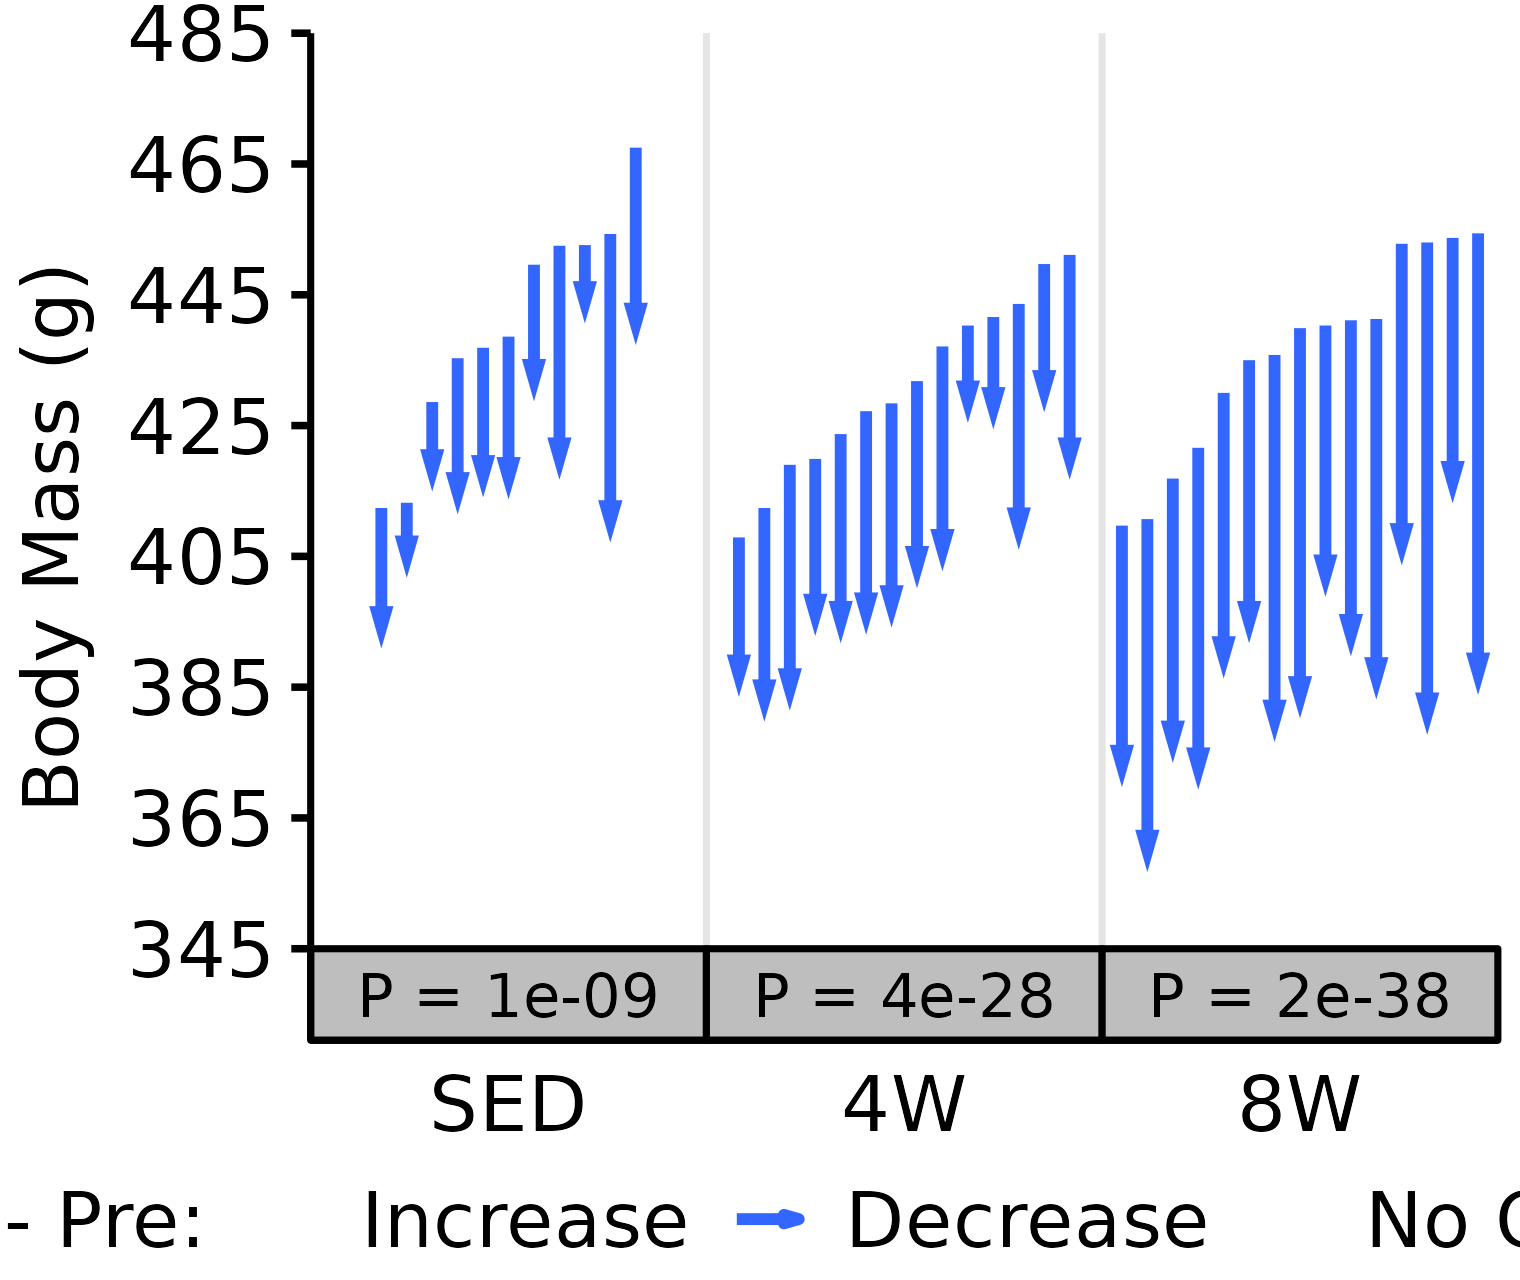
1W, 2W: Terminal - Pre NMR Body Mass
Pre: body mass recorded on the same day as the NMR body composition measures in the 1W and 2W groups. Post: body mass recorded upon death (terminal body mass).
6M Female
# 6M Female terminal - NMR Body Mass
plot_pre_post(x = filter(BODY_MASSES, age == "6M", sex == "Female",
                         group %in% c("1W", "2W")),
              pre = "nmr_pre_body_mass", post = "term_body_mass",
              stats = filter(PRE_POST_STATS,
                             response == "Term - NMR Pre Body Mass",
                             age == "6M", sex == "Female"),
              ymin = 170, ymax = 210) +
  scale_y_continuous(name = "Body Mass (g)",
                     breaks = seq(170, 210, 10),
                     expand = expansion(mult = c(0, 5e-3)))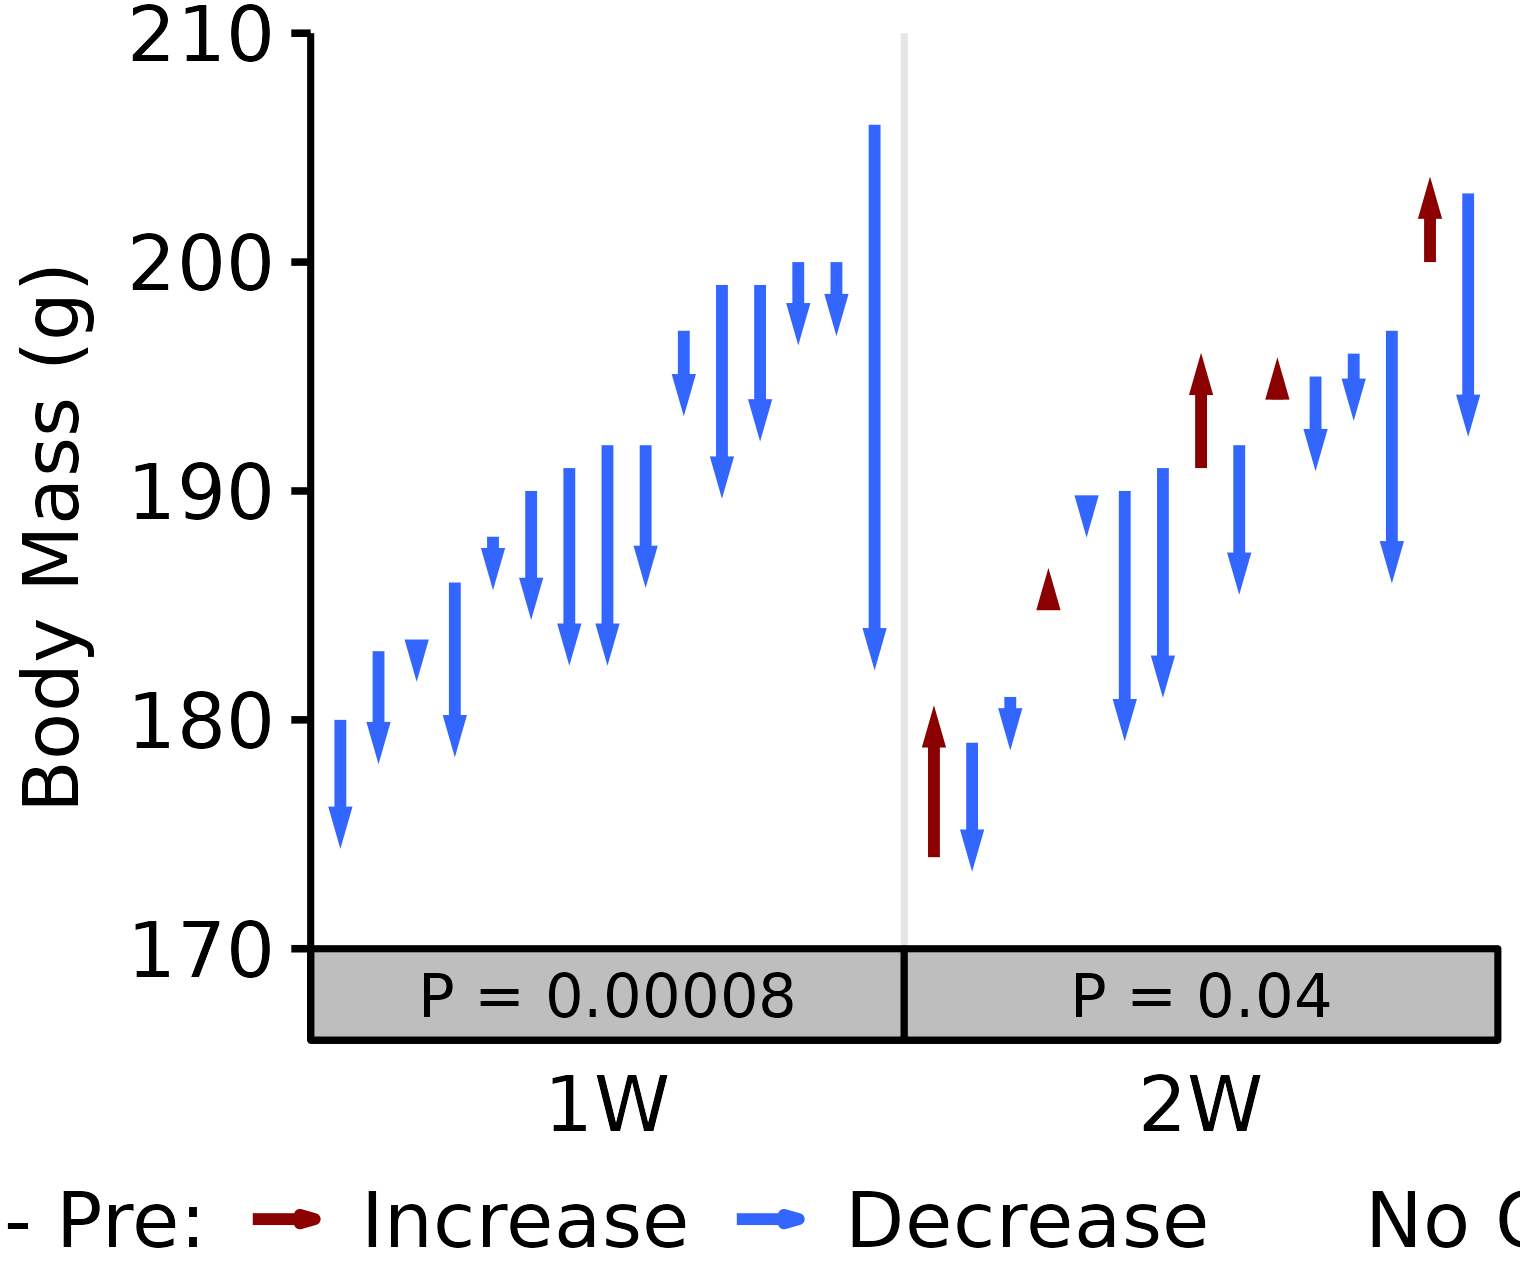
6M Male
# 6M Male terminal - NMR Body Mass
plot_pre_post(x = filter(BODY_MASSES, age == "6M", sex == "Male",
                         group %in% c("1W", "2W")),
              pre = "nmr_pre_body_mass", post = "term_body_mass",
              stats = filter(PRE_POST_STATS,
                             response == "Term - NMR Pre Body Mass",
                             age == "6M", sex == "Male"),
              ymin = 290, ymax = 430) +
  scale_y_continuous(name = "Body Mass (g)",
                     breaks = seq(290, 430, 20),
                     expand = expansion(mult = c(0, 5e-3)))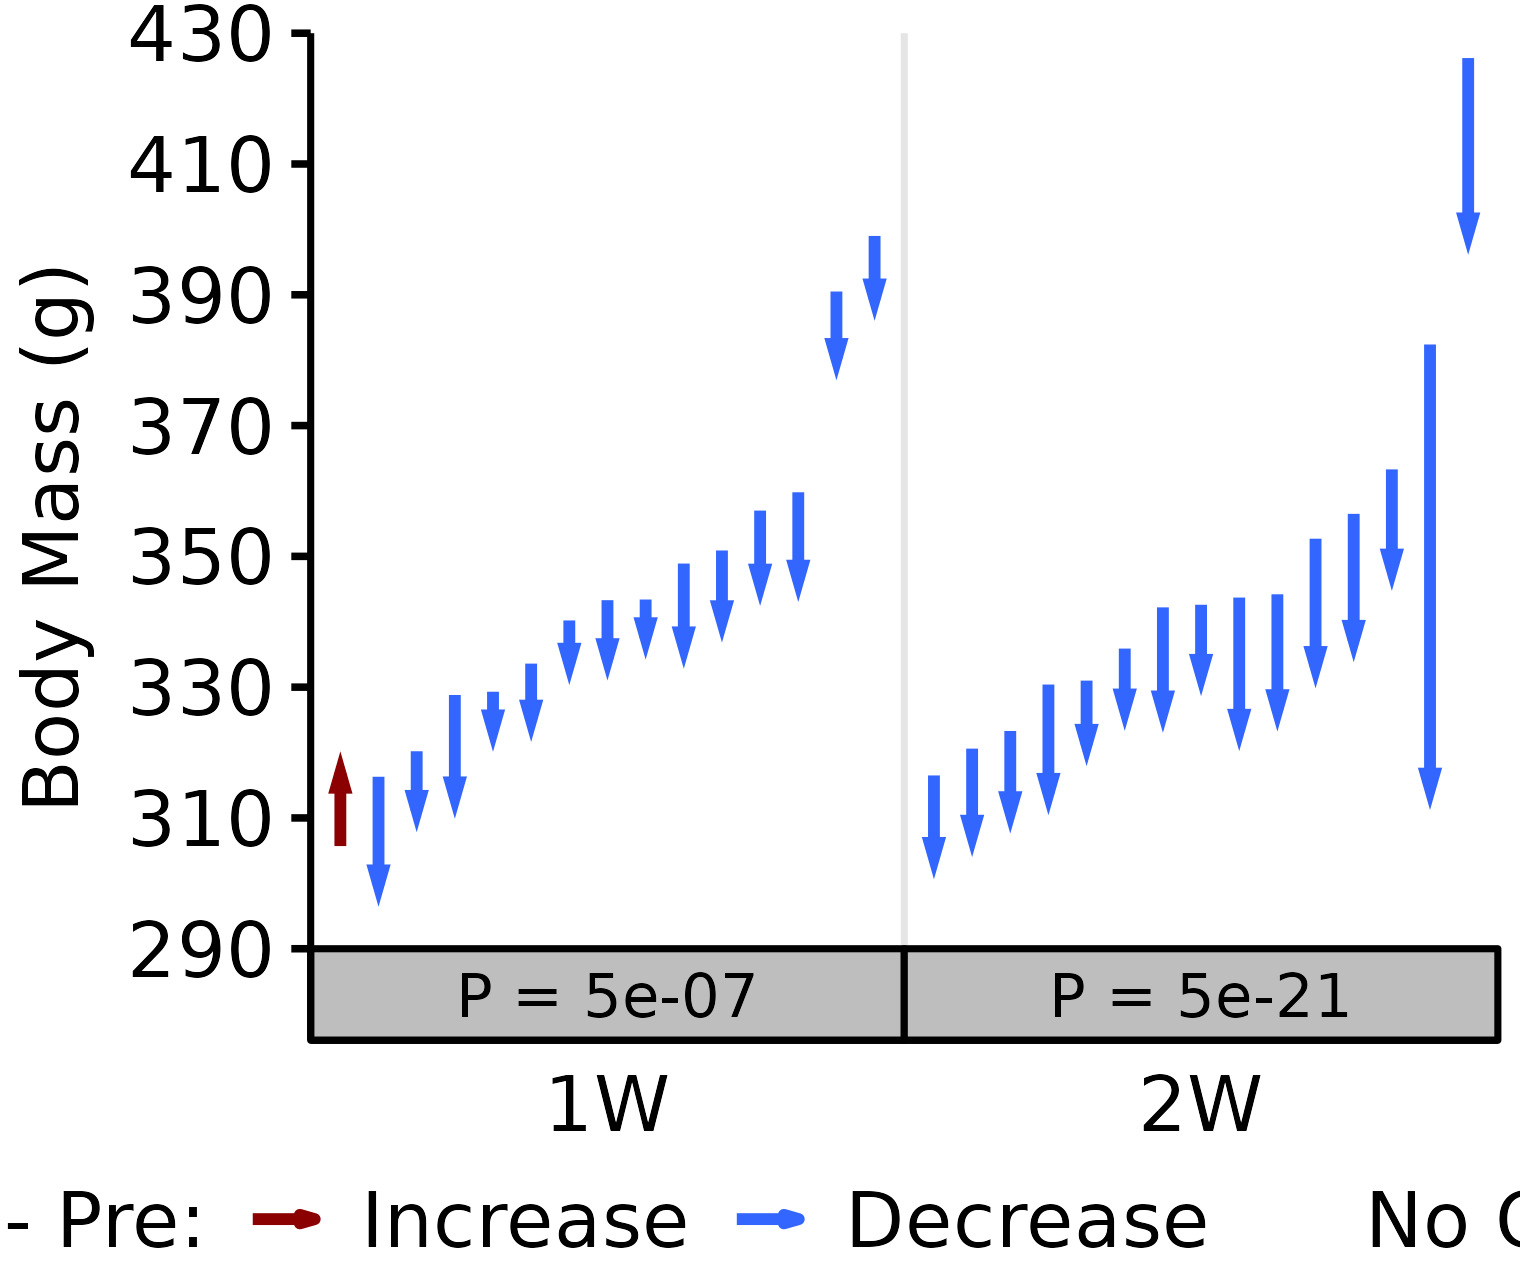
18M Female
# 18M Female terminal - NMR Body Mass
plot_pre_post(x = filter(BODY_MASSES, age == "18M", sex == "Female",
                         group %in% c("1W", "2W")),
              pre = "nmr_pre_body_mass", post = "term_body_mass",
              stats = filter(PRE_POST_STATS,
                             response == "Term - NMR Pre Body Mass",
                             age == "18M", sex == "Female"),
              ymin = 190, ymax = 270) +
  scale_y_continuous(name = "Body Mass (g)",
                     breaks = seq(190, 270, 20),
                     expand = expansion(mult = c(0, 5e-3)))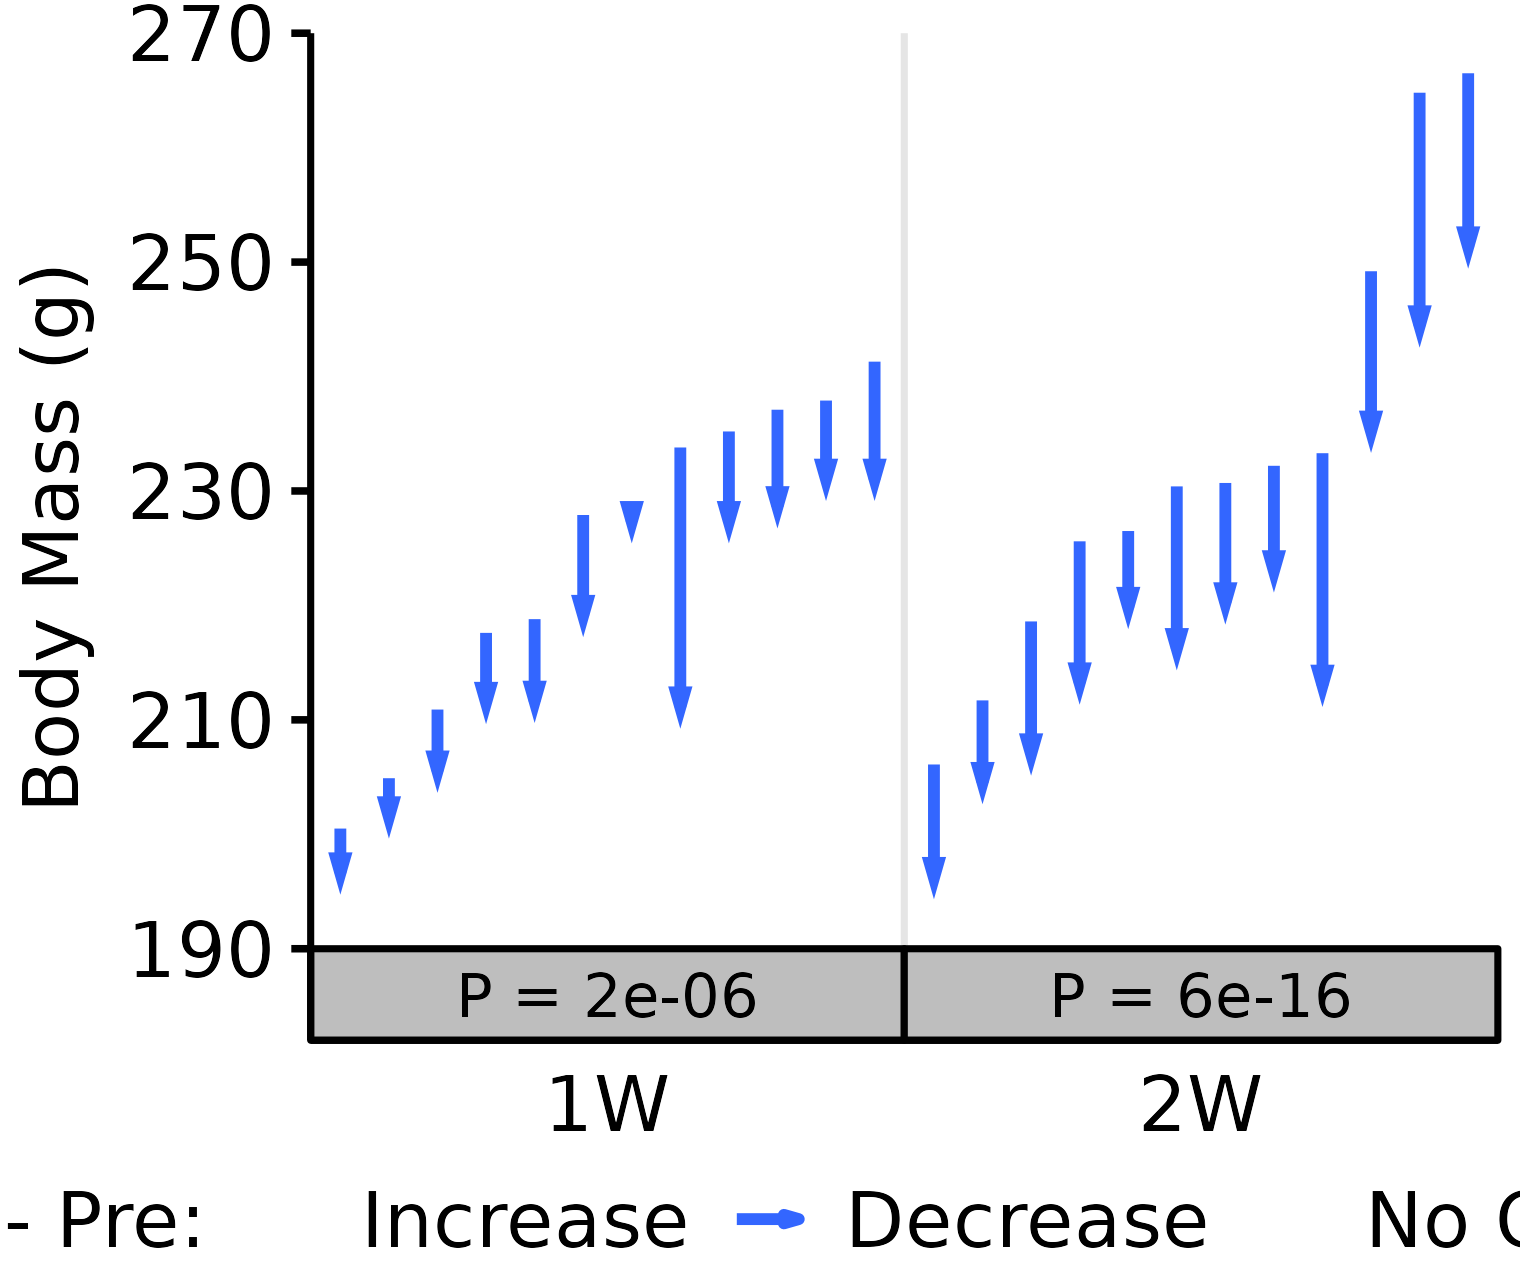
18M Male
# 18M Male terminal - NMR Body Mass
plot_pre_post(x = filter(BODY_MASSES, age == "18M", sex == "Male",
                         group %in% c("1W", "2W")),
              pre = "nmr_pre_body_mass", post = "term_body_mass",
              stats = filter(PRE_POST_STATS,
                             response == "Term - NMR Pre Body Mass",
                             age == "18M", sex == "Male"),
              ymin = 350, ymax = 470) +
  scale_y_continuous(name = "Body Mass (g)",
                     breaks = seq(350, 470, 20),
                     expand = expansion(mult = c(0, 5e-3)))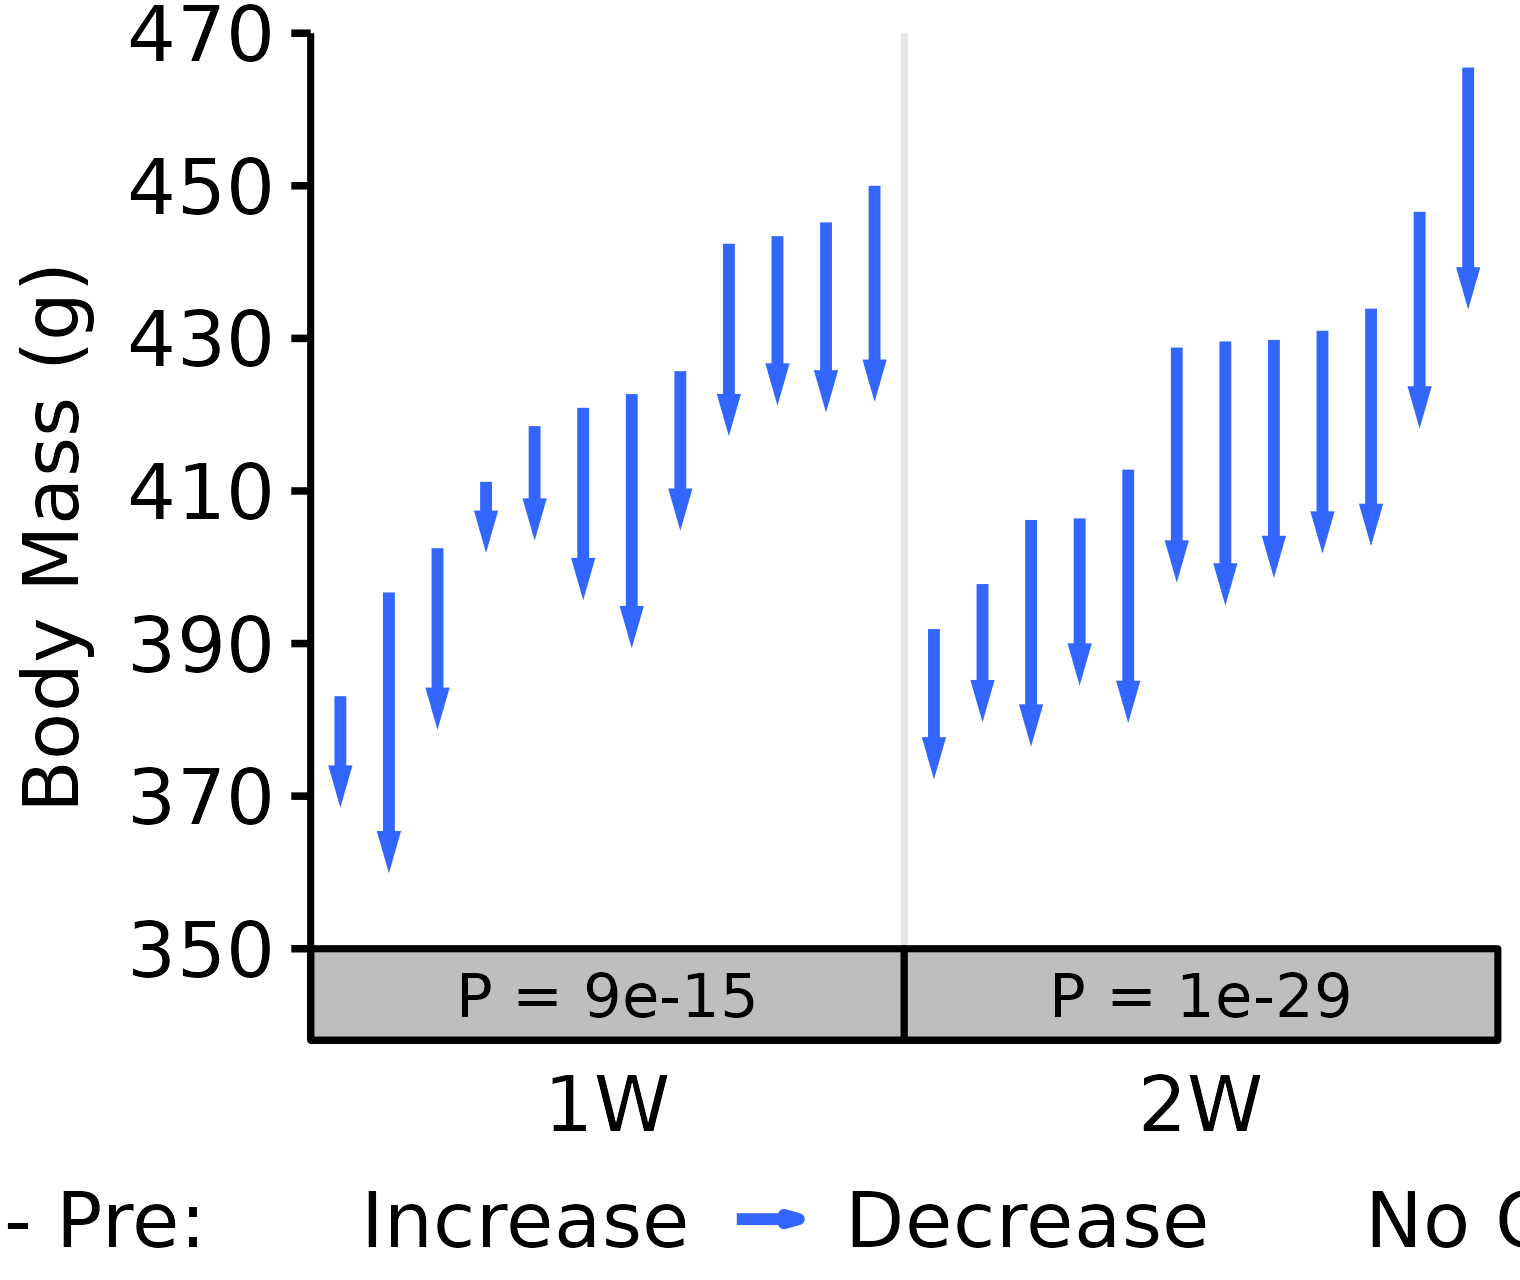
NMR Fat
Fat mass (g) recorded via NMR.
6M Female
# 6M Female NMR Fat
plot_pre_post(x = filter(NMR, age == "6M", sex == "Female"),
              pre = "pre_fat", post = "post_fat",
              stats = filter(PRE_POST_STATS, response == "NMR Fat Mass",
                             age == "6M", sex == "Female"),
              ymin = 10, ymax = 35) +
  scale_y_continuous(name = "NMR Fat Mass (g)",
                     breaks = seq(10, 35, 5),
                     expand = expansion(mult = c(0, 5e-3)))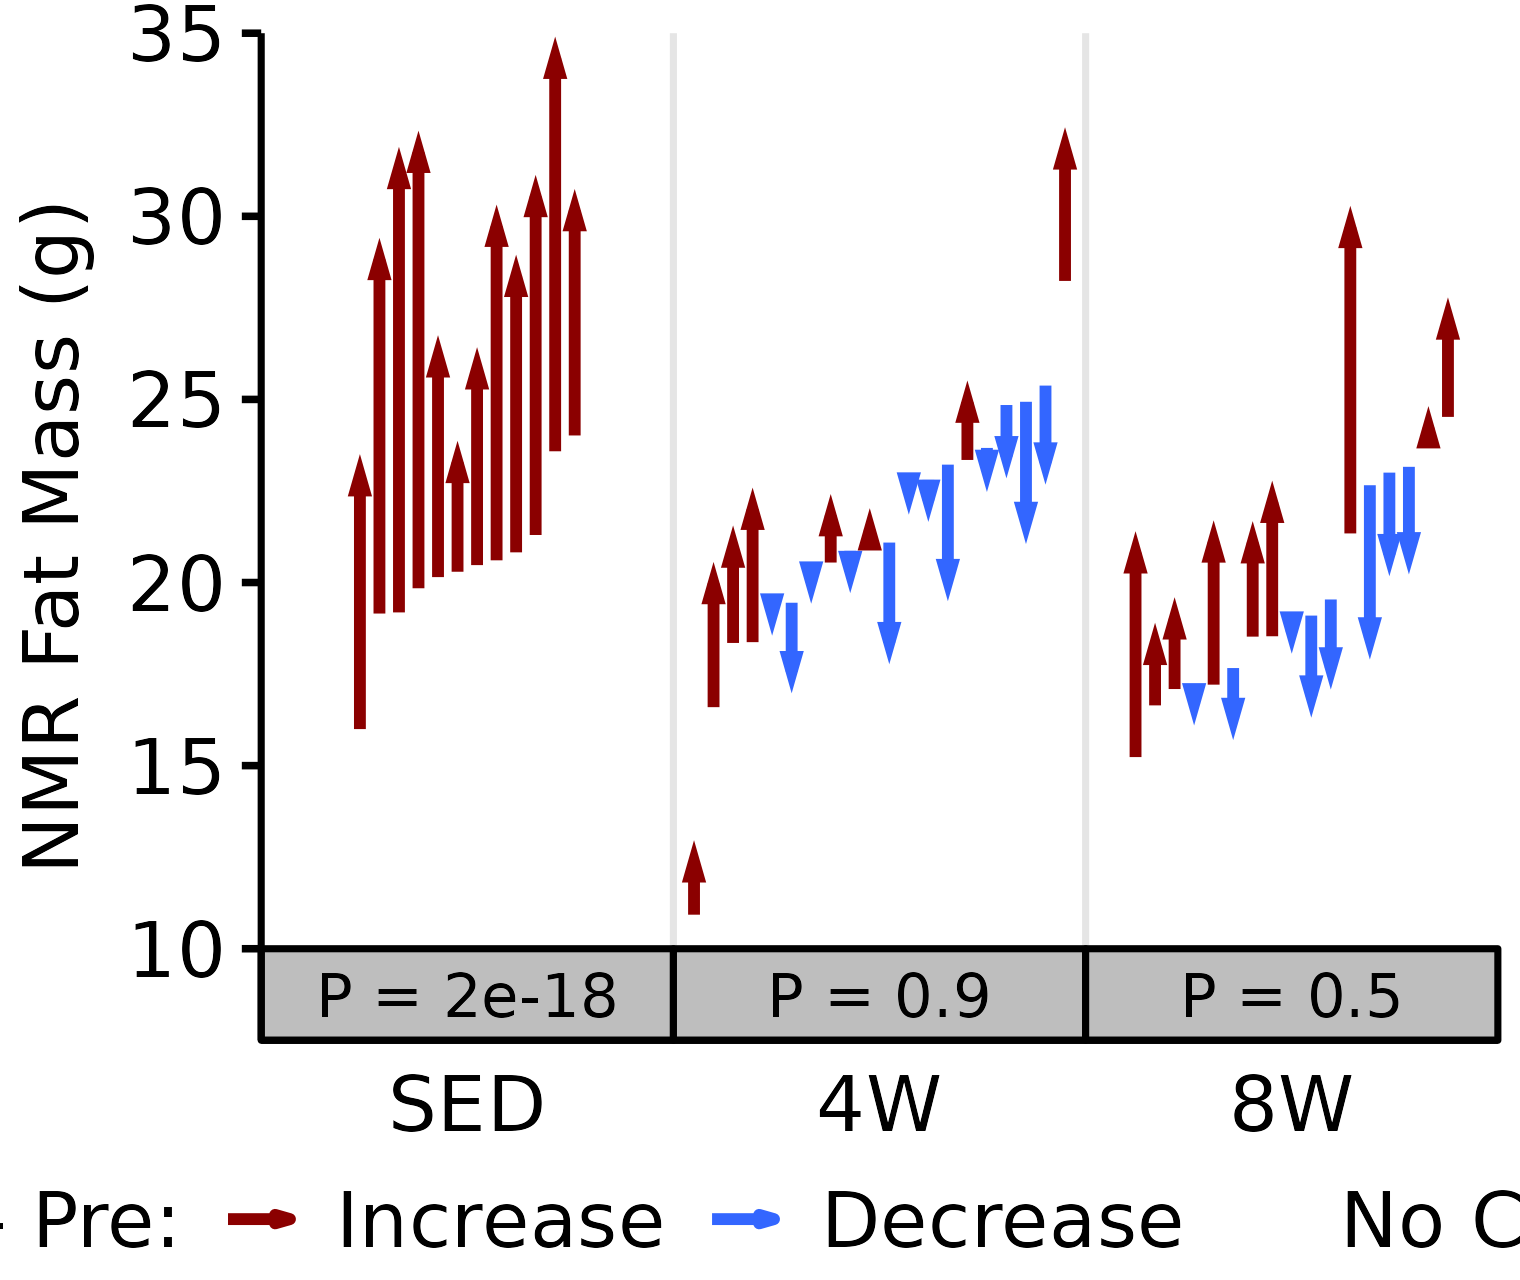
6M Male
# 6M Male NMR Fat
plot_pre_post(x = filter(NMR, age == "6M", sex == "Male"),
              pre = "pre_fat", post = "post_fat",
              stats = filter(PRE_POST_STATS, response == "NMR Fat Mass",
                             age == "6M", sex == "Male"),
              ymin = 10, ymax = 80) +
  scale_y_continuous(name = "NMR Fat Mass (g)",
                     breaks = seq(10, 80, 10),
                     expand = expansion(mult = c(0, 5e-3)))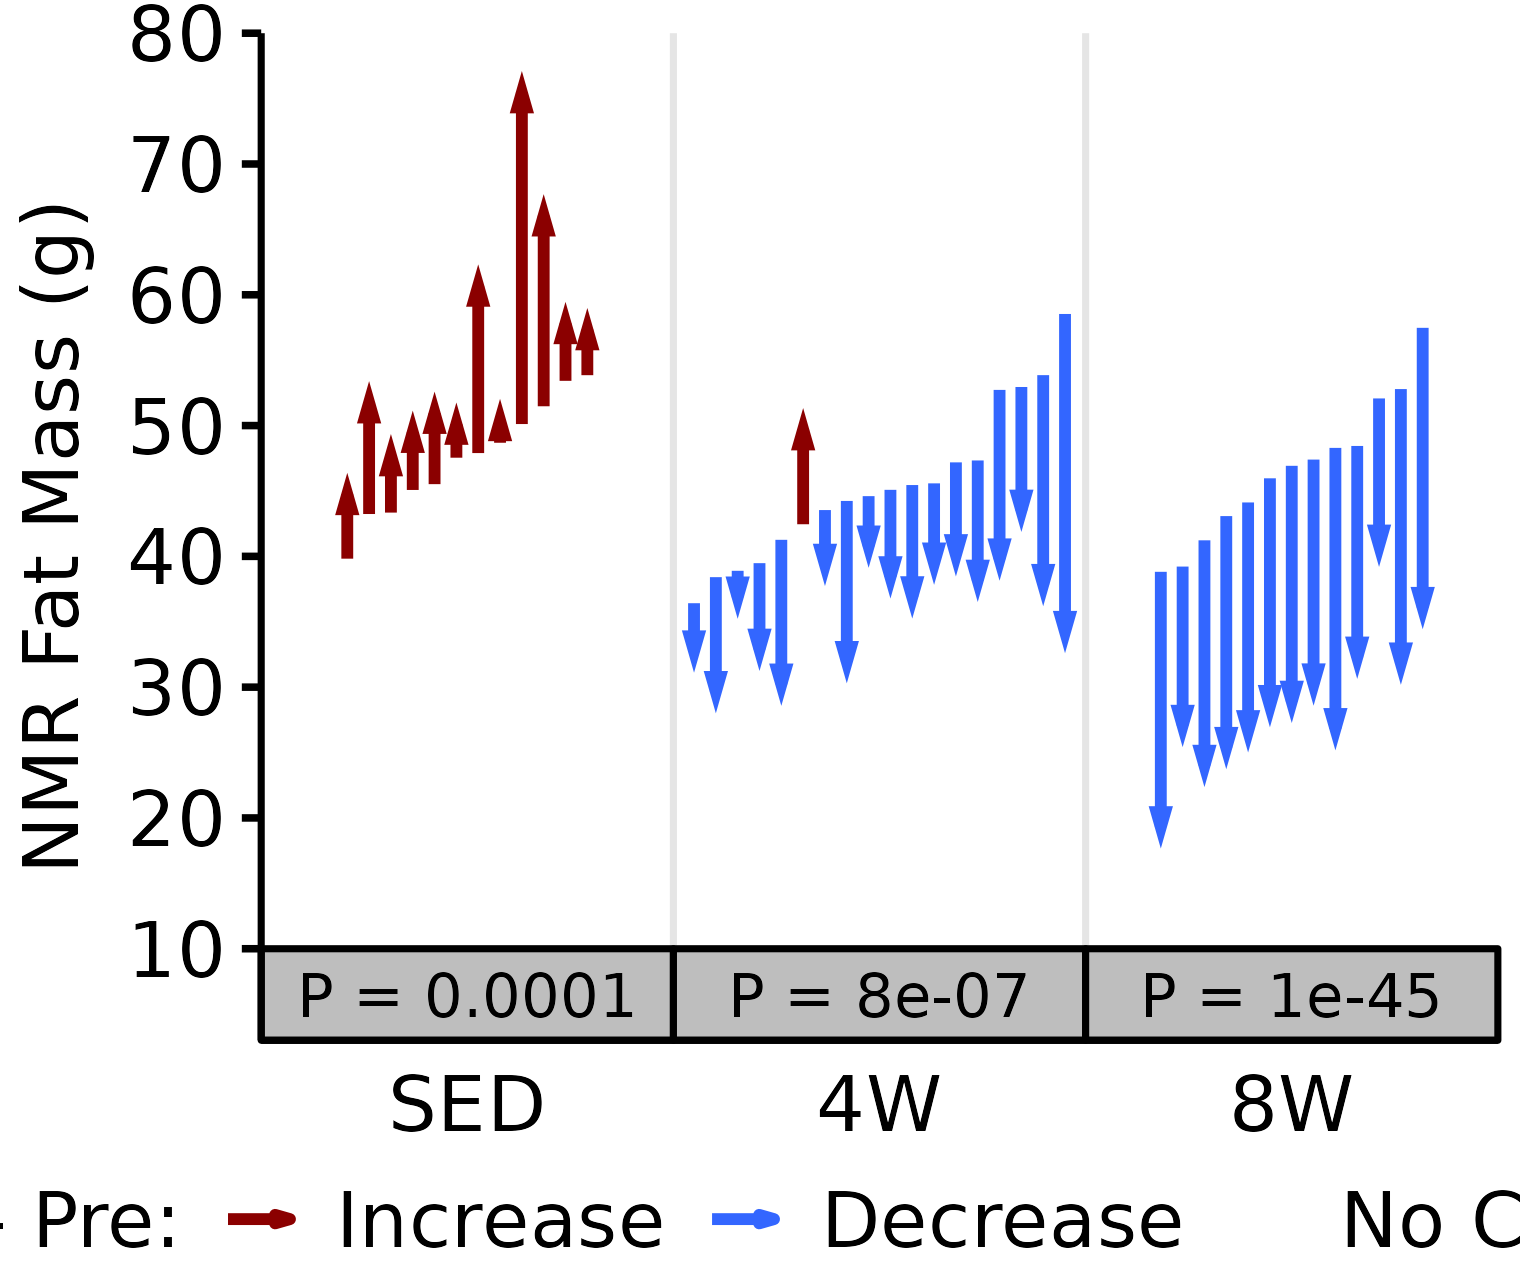
18M Female
# 18M Female NMR Fat
plot_pre_post(x = filter(NMR, age == "18M", sex == "Female"),
              pre = "pre_fat", post = "post_fat",
              stats = filter(PRE_POST_STATS, response == "NMR Fat Mass",
                             age == "18M", sex == "Female"),
              ymin = 25, ymax = 65) +
  scale_y_continuous(name = "NMR Fat Mass (g)",
                     breaks = seq(25, 65, 10),
                     expand = expansion(mult = c(0, 5e-3)))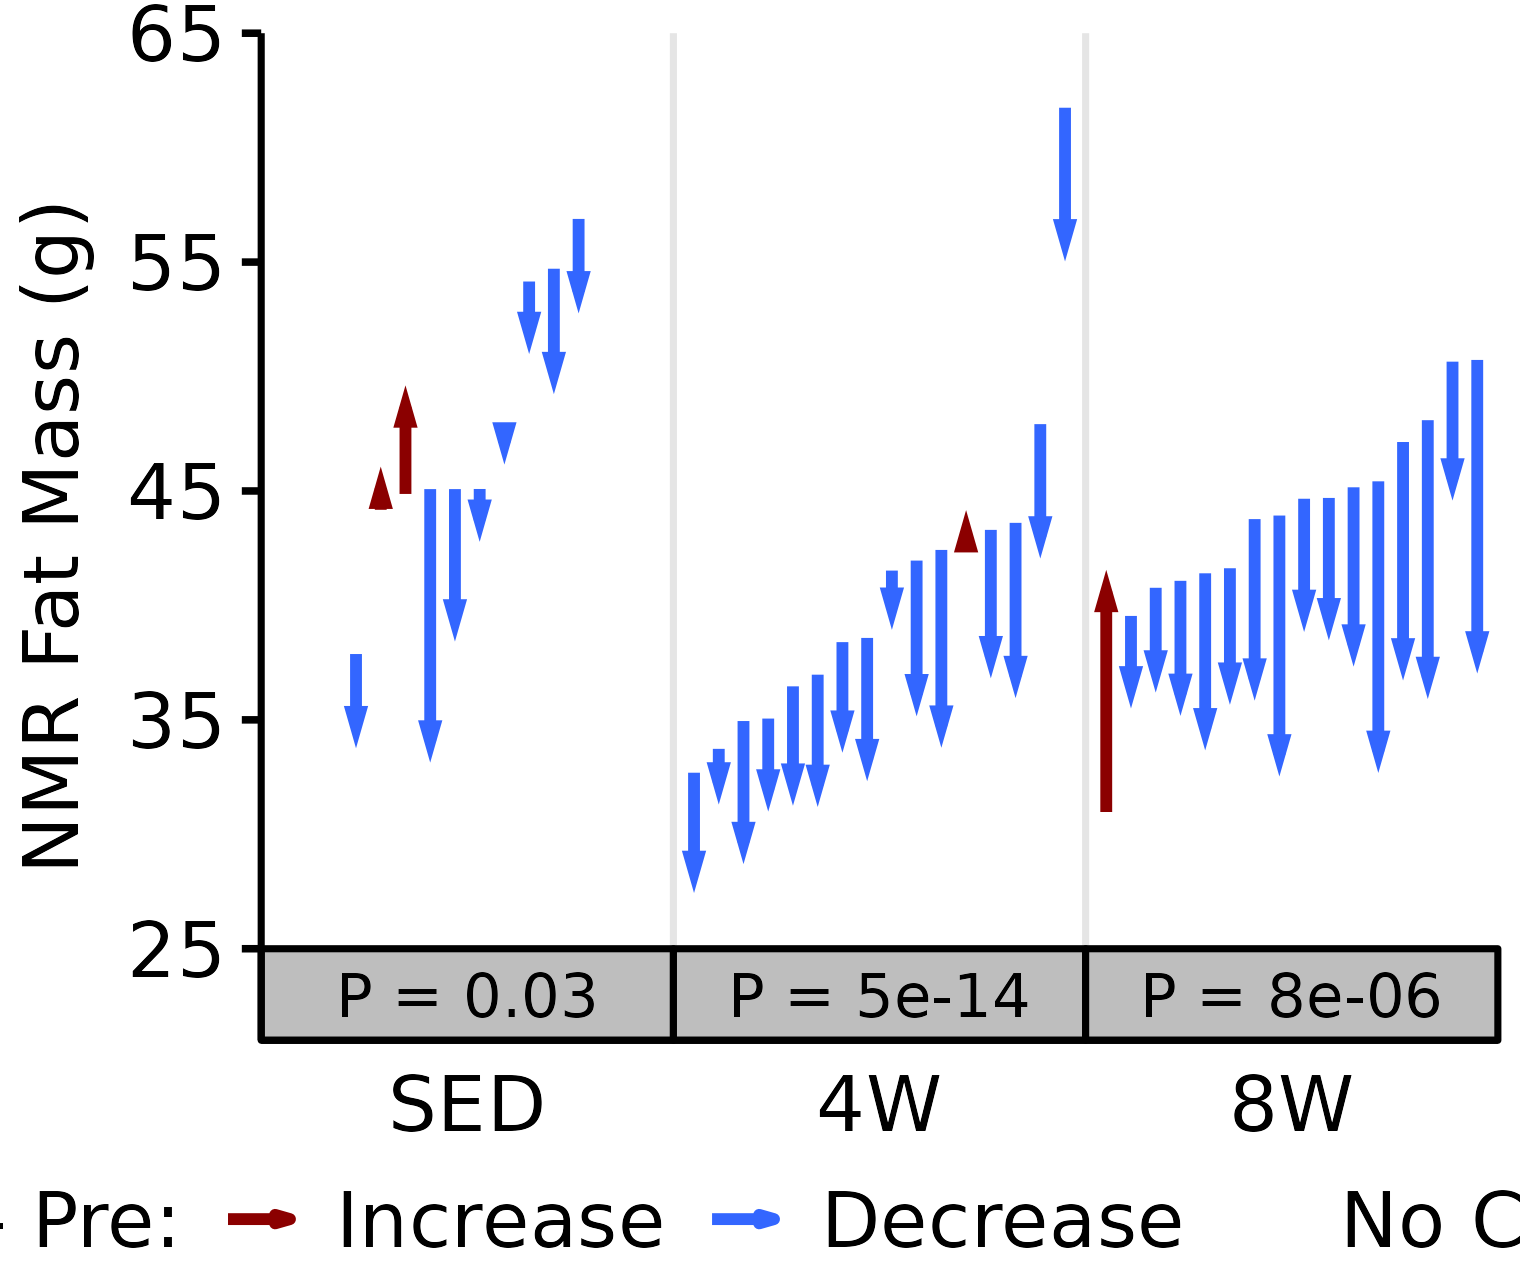
18M Male
# 18M Male NMR Fat
plot_pre_post(x = filter(NMR, age == "18M", sex == "Male"),
              pre = "pre_fat", post = "post_fat",
              stats = filter(PRE_POST_STATS, response == "NMR Fat Mass",
                             age == "18M", sex == "Male"),
              ymin = 35, ymax = 105) +
  scale_y_continuous(name = "NMR Fat Mass (g)",
                     breaks = seq(35, 105, 10),
                     expand = expansion(mult = c(0, 5e-3)))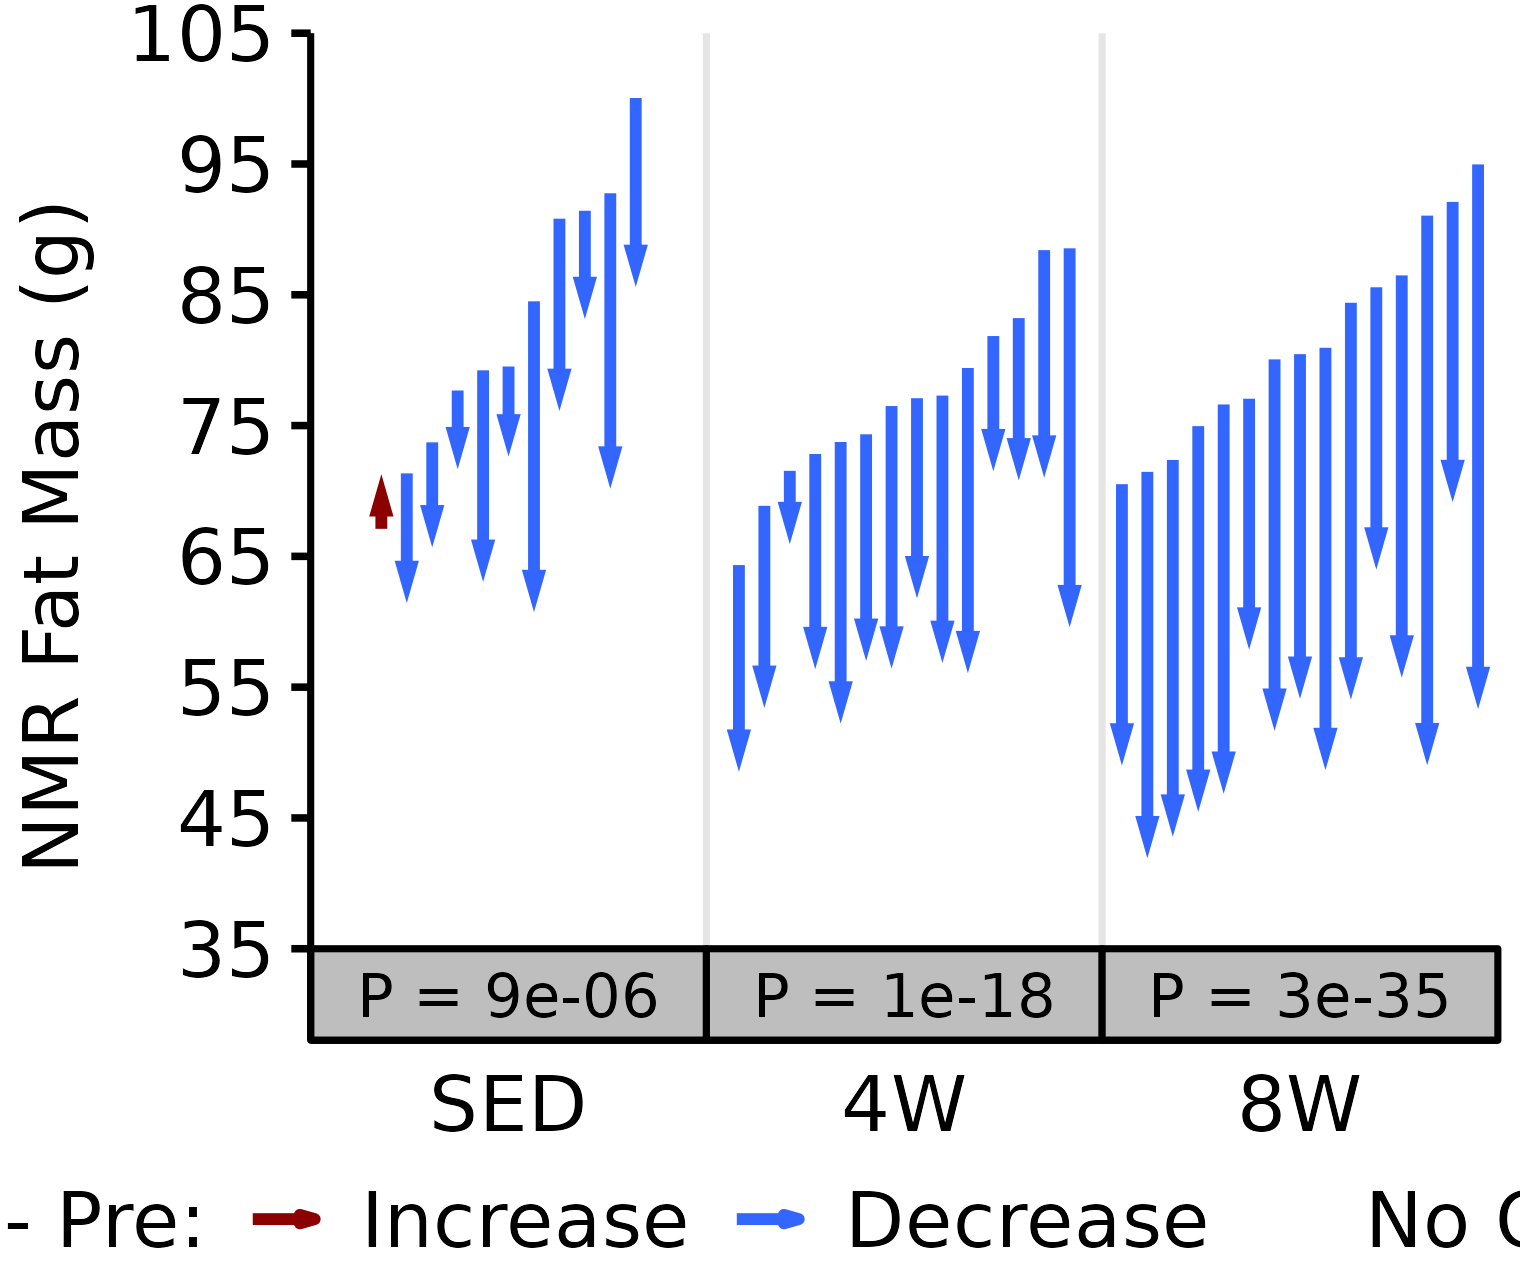
NMR Lean
Lean mass (g) recorded via NMR.
6M Female
# 6M Female NMR Lean
plot_pre_post(x = filter(NMR, age == "6M", sex == "Female"),
              pre = "pre_lean", post = "post_lean",
              stats = filter(PRE_POST_STATS, response == "NMR Lean Mass",
                             age == "6M", sex == "Female"),
              ymin = 90, ymax = 140) +
  scale_y_continuous(name = "NMR Lean Mass (g)",
                     breaks = seq(90, 140, 10),
                     expand = expansion(mult = c(0, 5e-3)))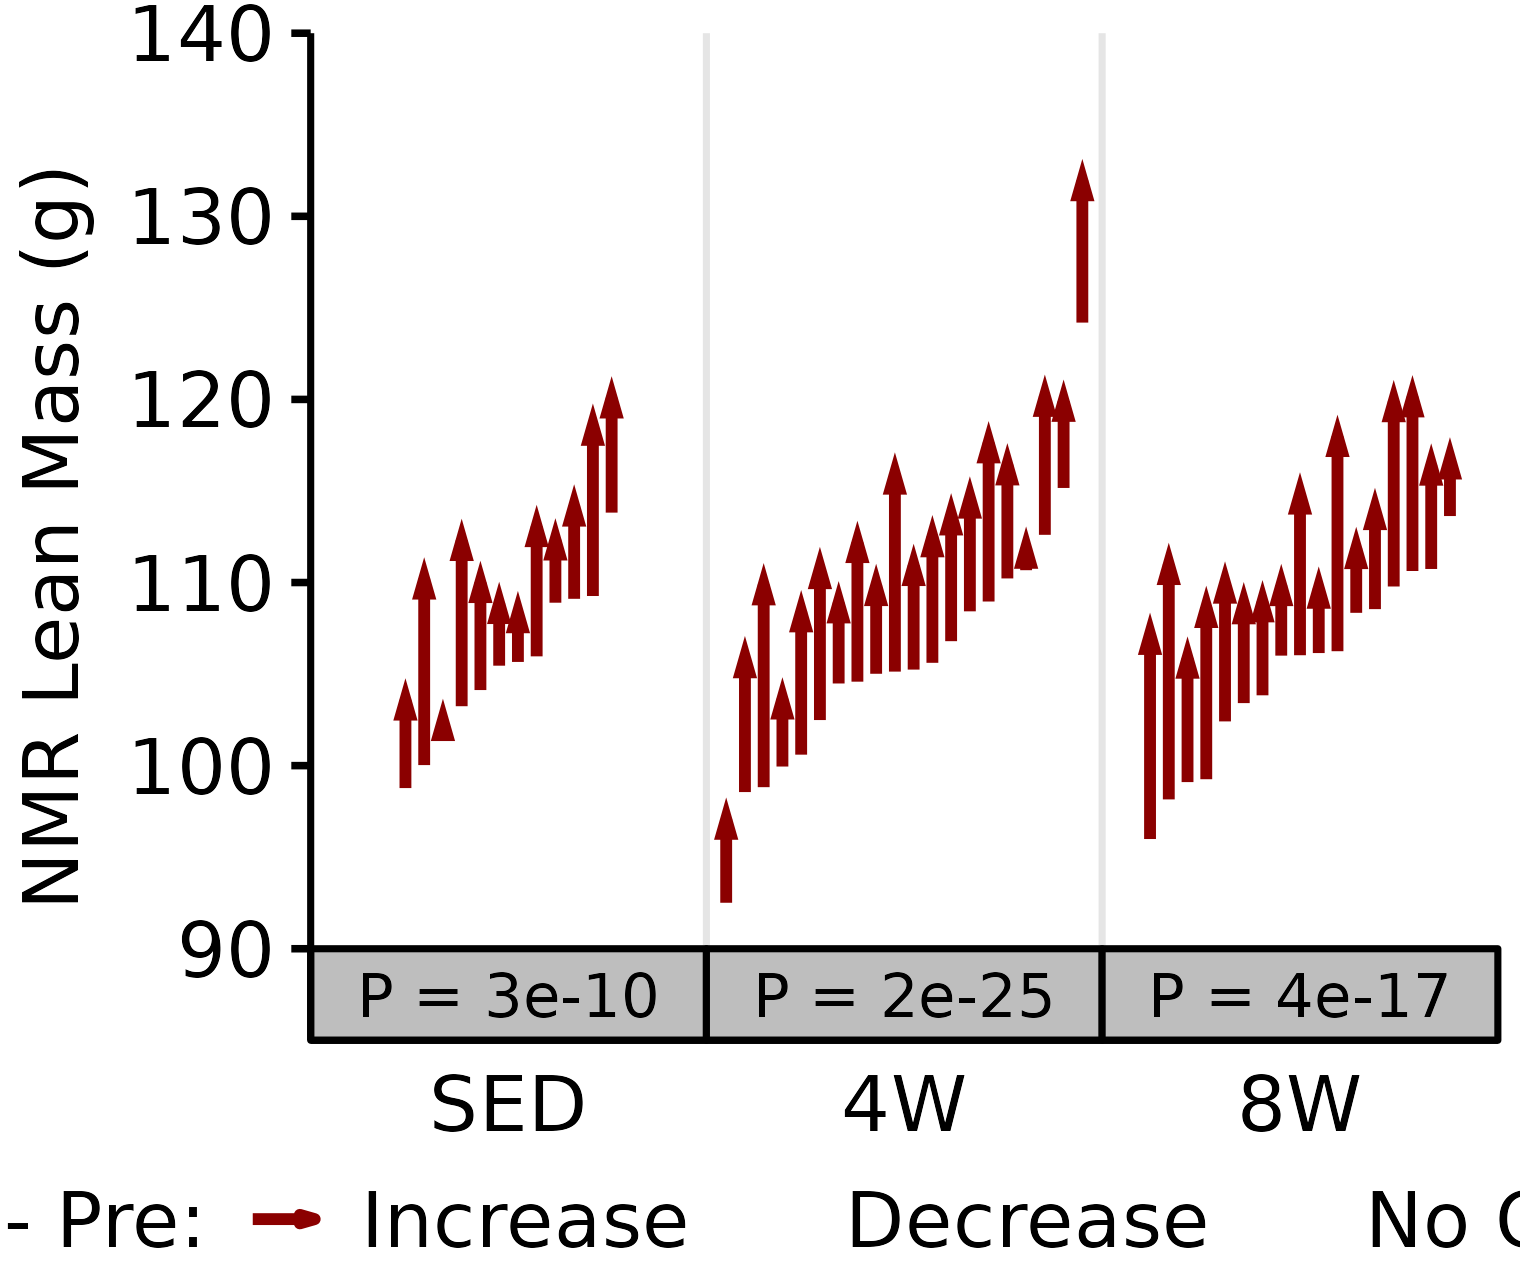
6M Male
# 6M Male NMR Lean
plot_pre_post(x = filter(NMR, age == "6M", sex == "Male"),
              pre = "pre_lean", post = "post_lean",
              stats = filter(PRE_POST_STATS, response == "NMR Lean Mass",
                             age == "6M", sex == "Male"),
              ymin = 140, ymax = 230) +
  scale_y_continuous(name = "NMR Lean Mass (g)",
                     breaks = seq(140, 230, 15),
                     expand = expansion(mult = c(0, 5e-3)))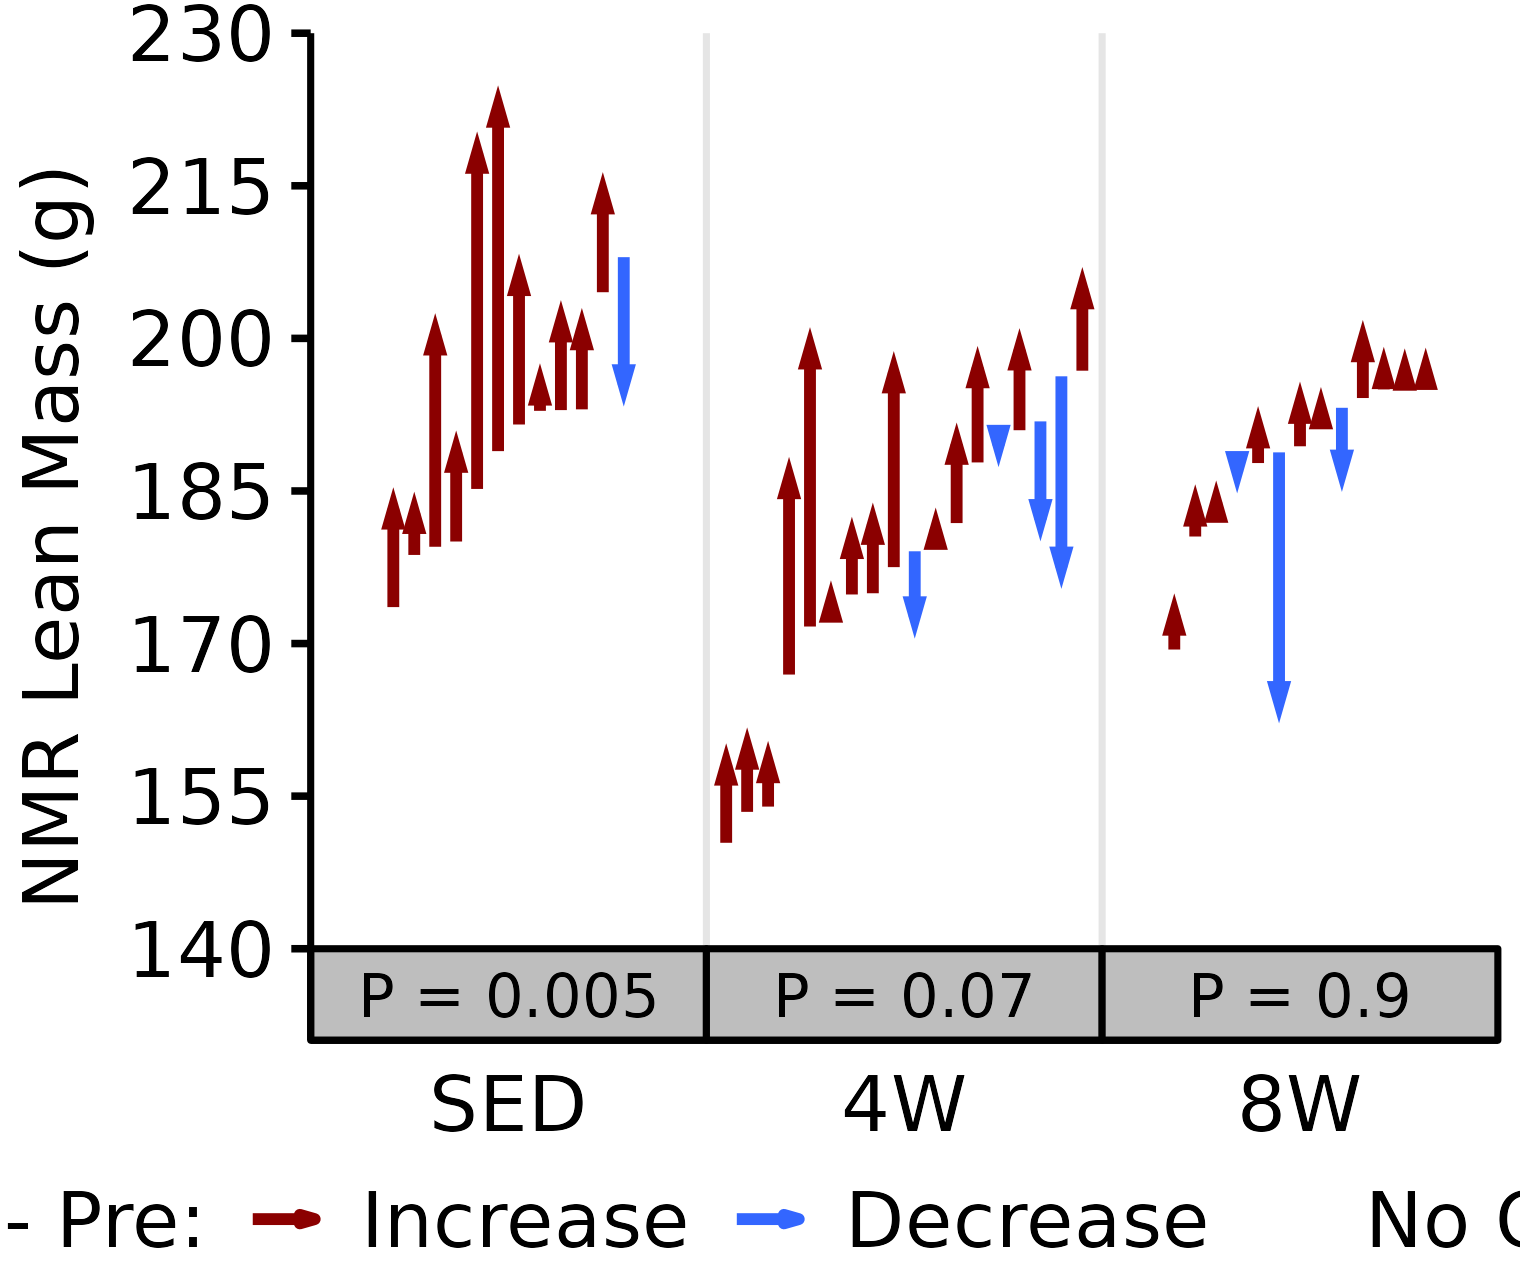
18M Female
# 18M Female NMR Lean
plot_pre_post(x = filter(NMR, age == "18M", sex == "Female"),
              pre = "pre_lean", post = "post_lean",
              stats = filter(PRE_POST_STATS, response == "NMR Lean Mass",
                             age == "18M", sex == "Female"),
              ymin = 105, ymax = 155) +
  scale_y_continuous(name = "NMR Lean Mass (g)",
                     breaks = seq(105, 155, 10),
                     expand = expansion(mult = c(0, 5e-3)))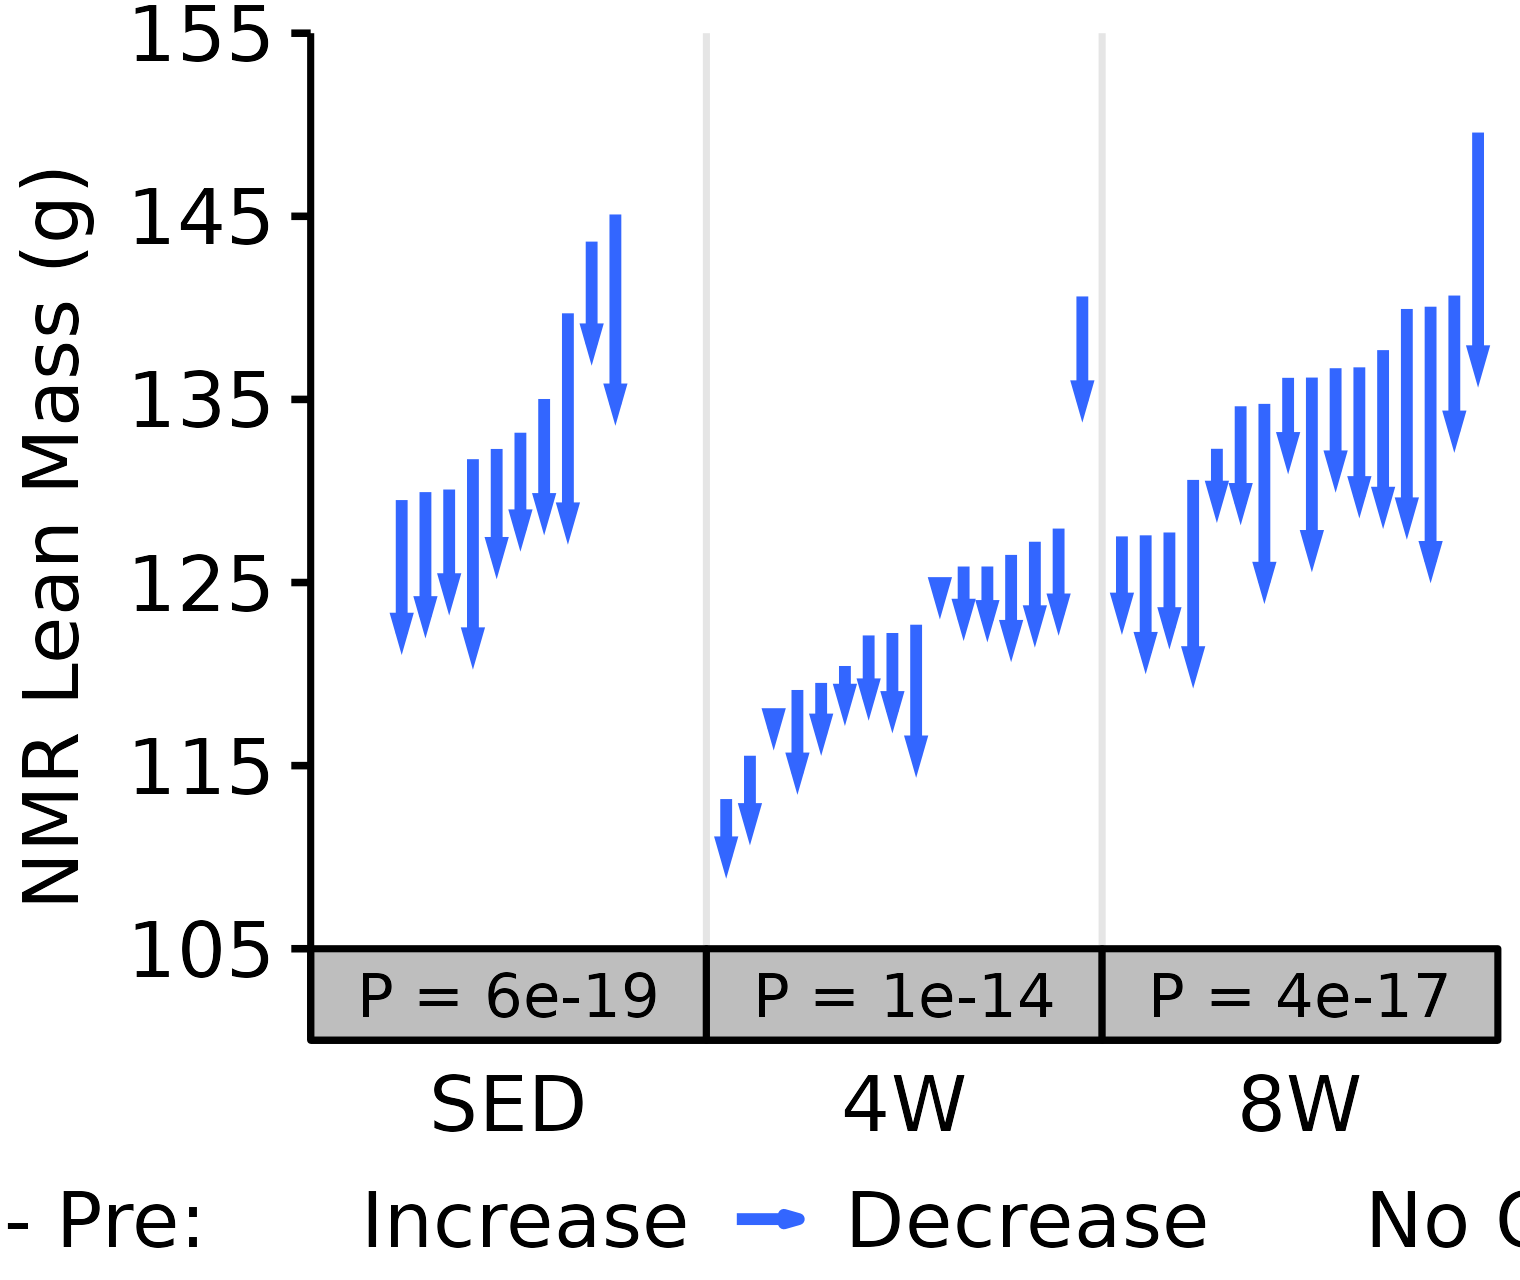
18M Male
# 18M Male NMR Lean
plot_pre_post(x = filter(NMR, age == "18M", sex == "Male"),
              pre = "pre_lean", post = "post_lean",
              stats = filter(PRE_POST_STATS, response == "NMR Lean Mass",
                             age == "18M", sex == "Male"),
              ymin = 195, ymax = 245) +
  scale_y_continuous(name = "NMR Lean Mass (g)",
                     breaks = seq(195, 245, 10),
                     expand = expansion(mult = c(0, 5e-3)))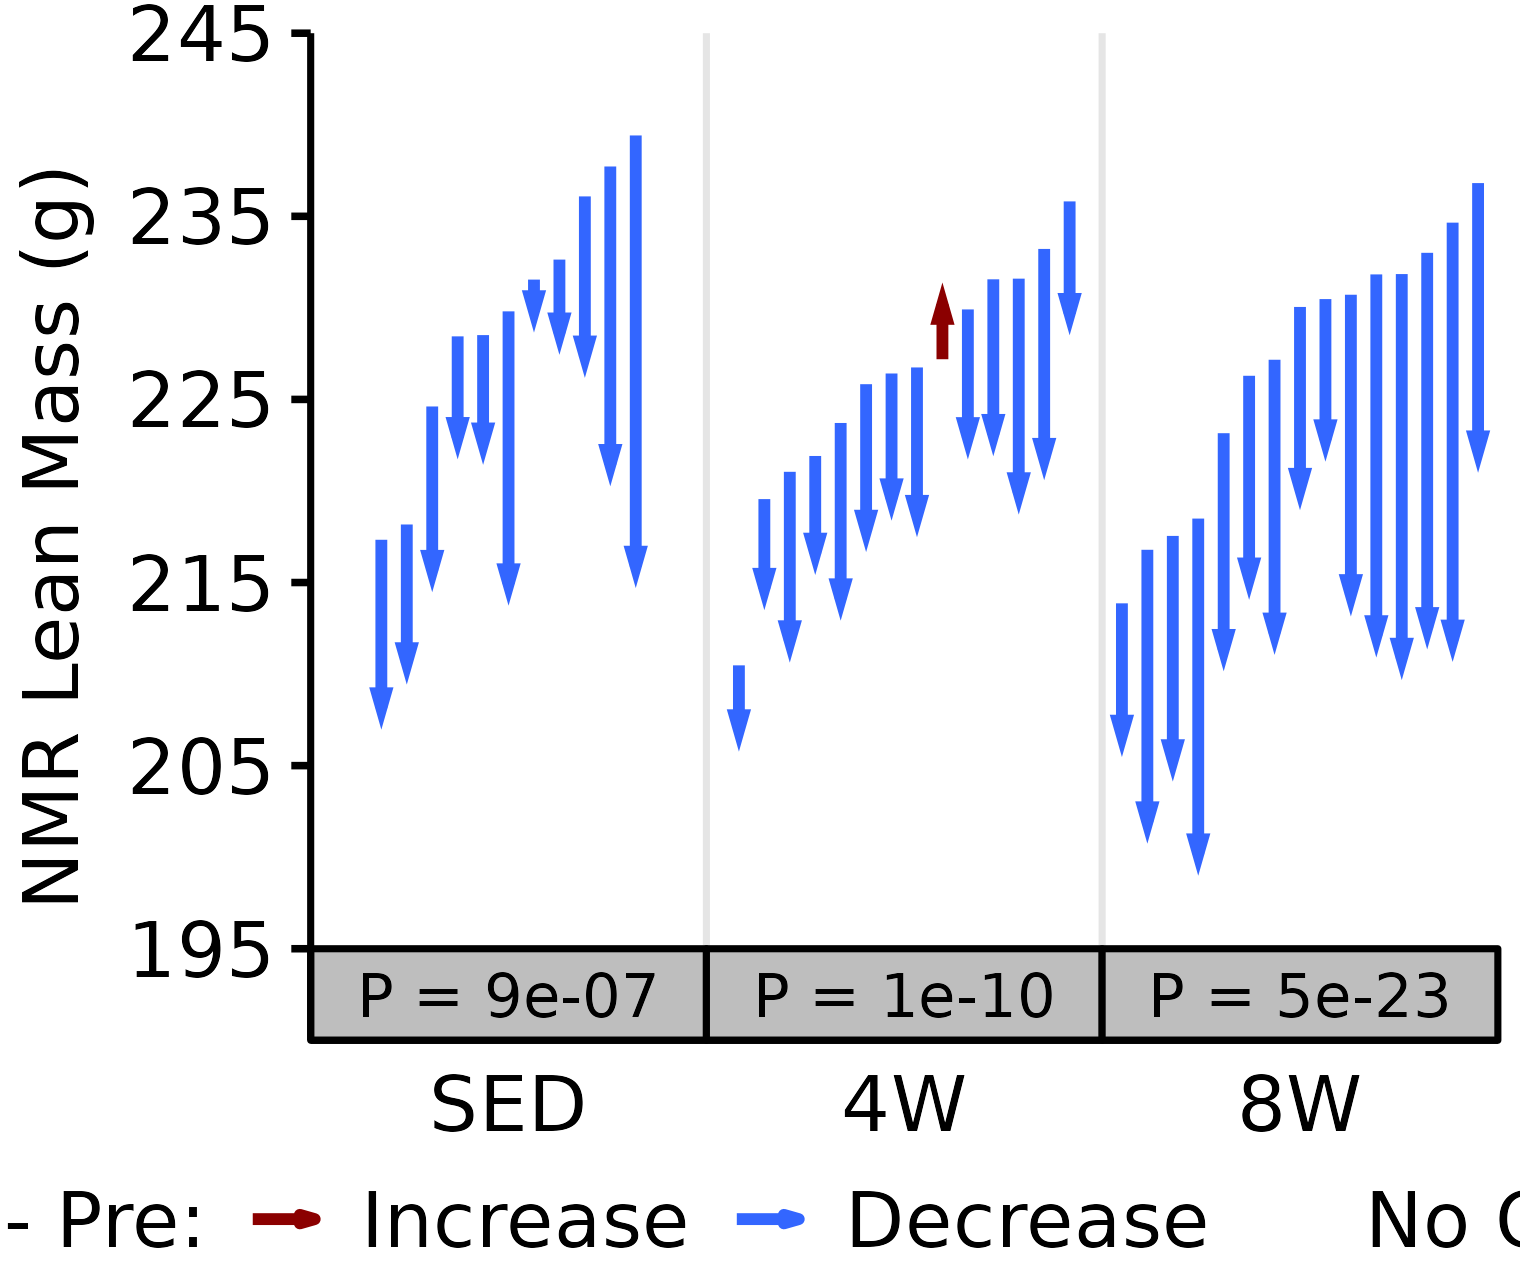
NMR % Fat
Fat mass (g) recorded via NMR divided by the body mass (g) recorded on the same day and then multiplied by 100%.
6M Female
# 6M Female NMR % Fat
plot_pre_post(x = filter(NMR, age == "6M", sex == "Female"),
              pre = "pre_fat_pct", post = "post_fat_pct",
              stats = filter(PRE_POST_STATS, response == "NMR % Fat",
                             age == "6M", sex == "Female"),
              ymin = 6, ymax = 18) +
  scale_y_continuous(name = "NMR % Fat Mass",
                     breaks = seq(6, 18, 2),
                     expand = expansion(mult = c(0, 5e-3)))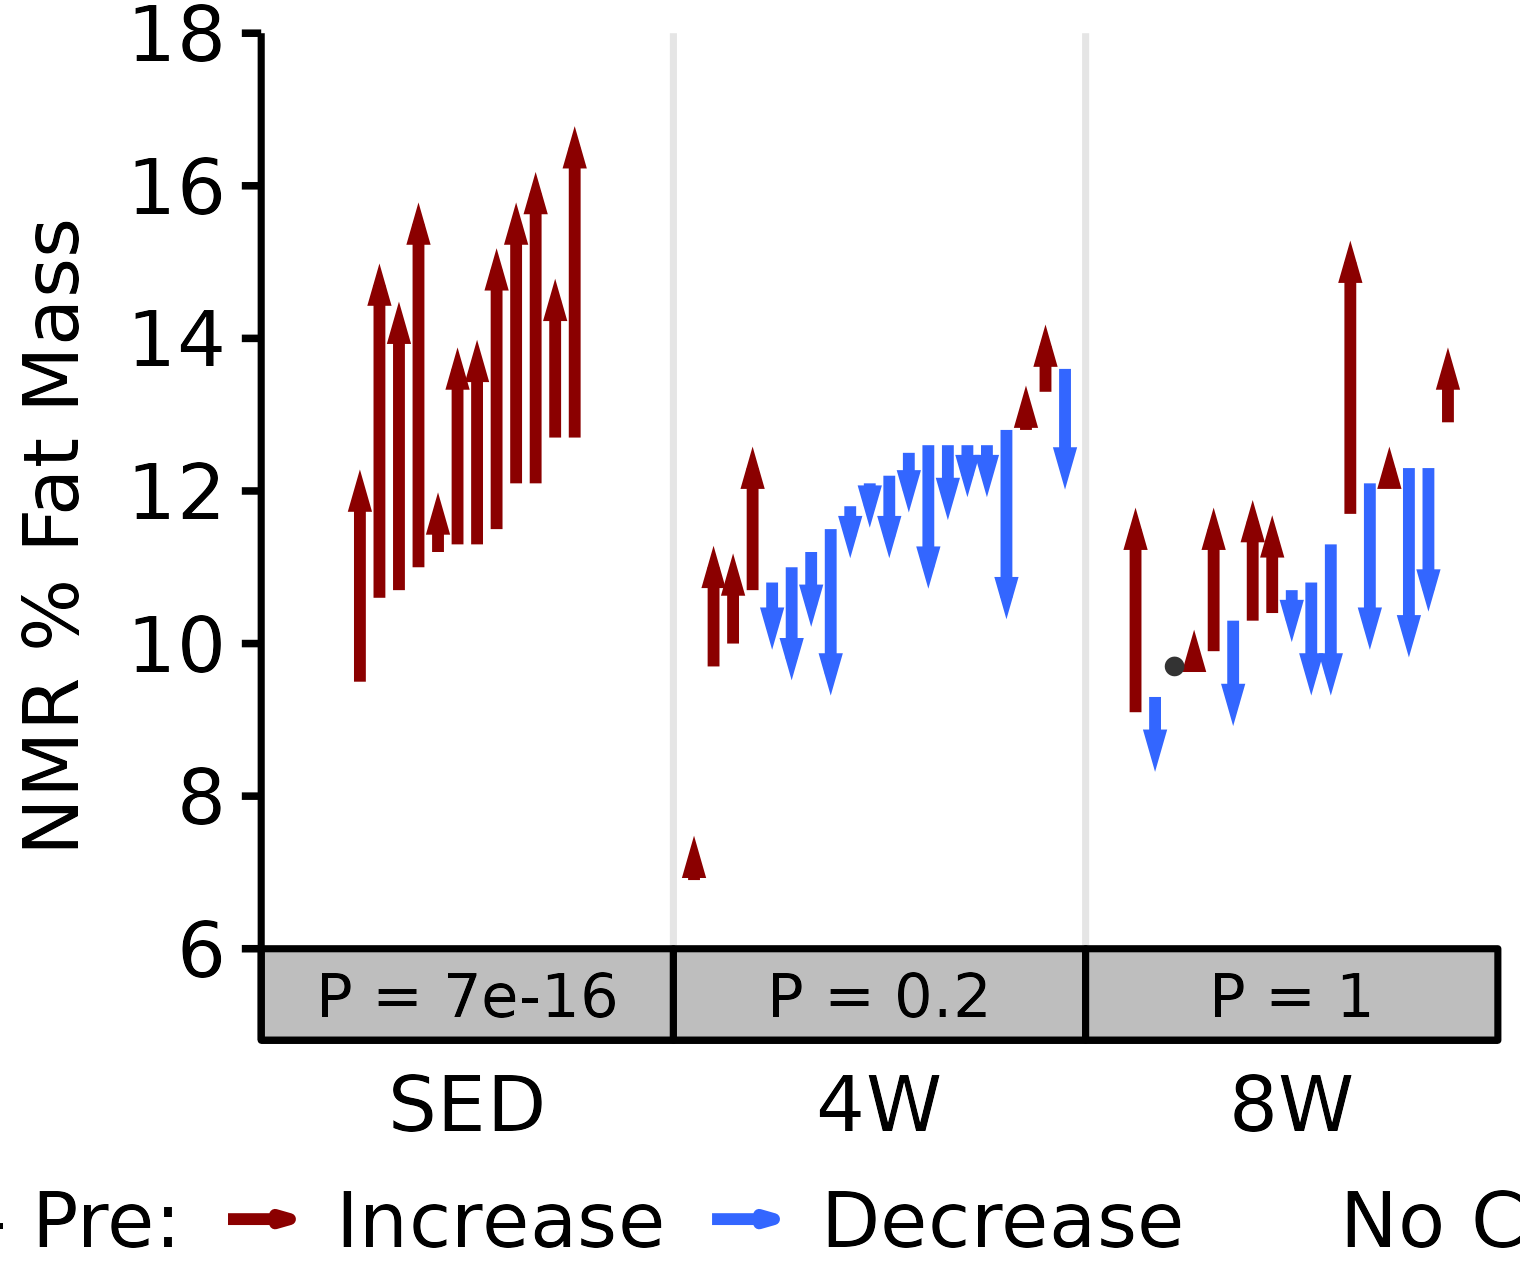
6M Male
# 6M Male NMR % Fat
plot_pre_post(x = filter(NMR, age == "6M", sex == "Male"),
              pre = "pre_fat_pct", post = "post_fat_pct",
              stats = filter(PRE_POST_STATS, response == "NMR % Fat",
                             age == "6M", sex == "Male"),
              ymin = 6, ymax = 20) +
  scale_y_continuous(name = "NMR % Fat Mass",
                     breaks = seq(6, 20, 2),
                     expand = expansion(mult = c(0, 5e-3)))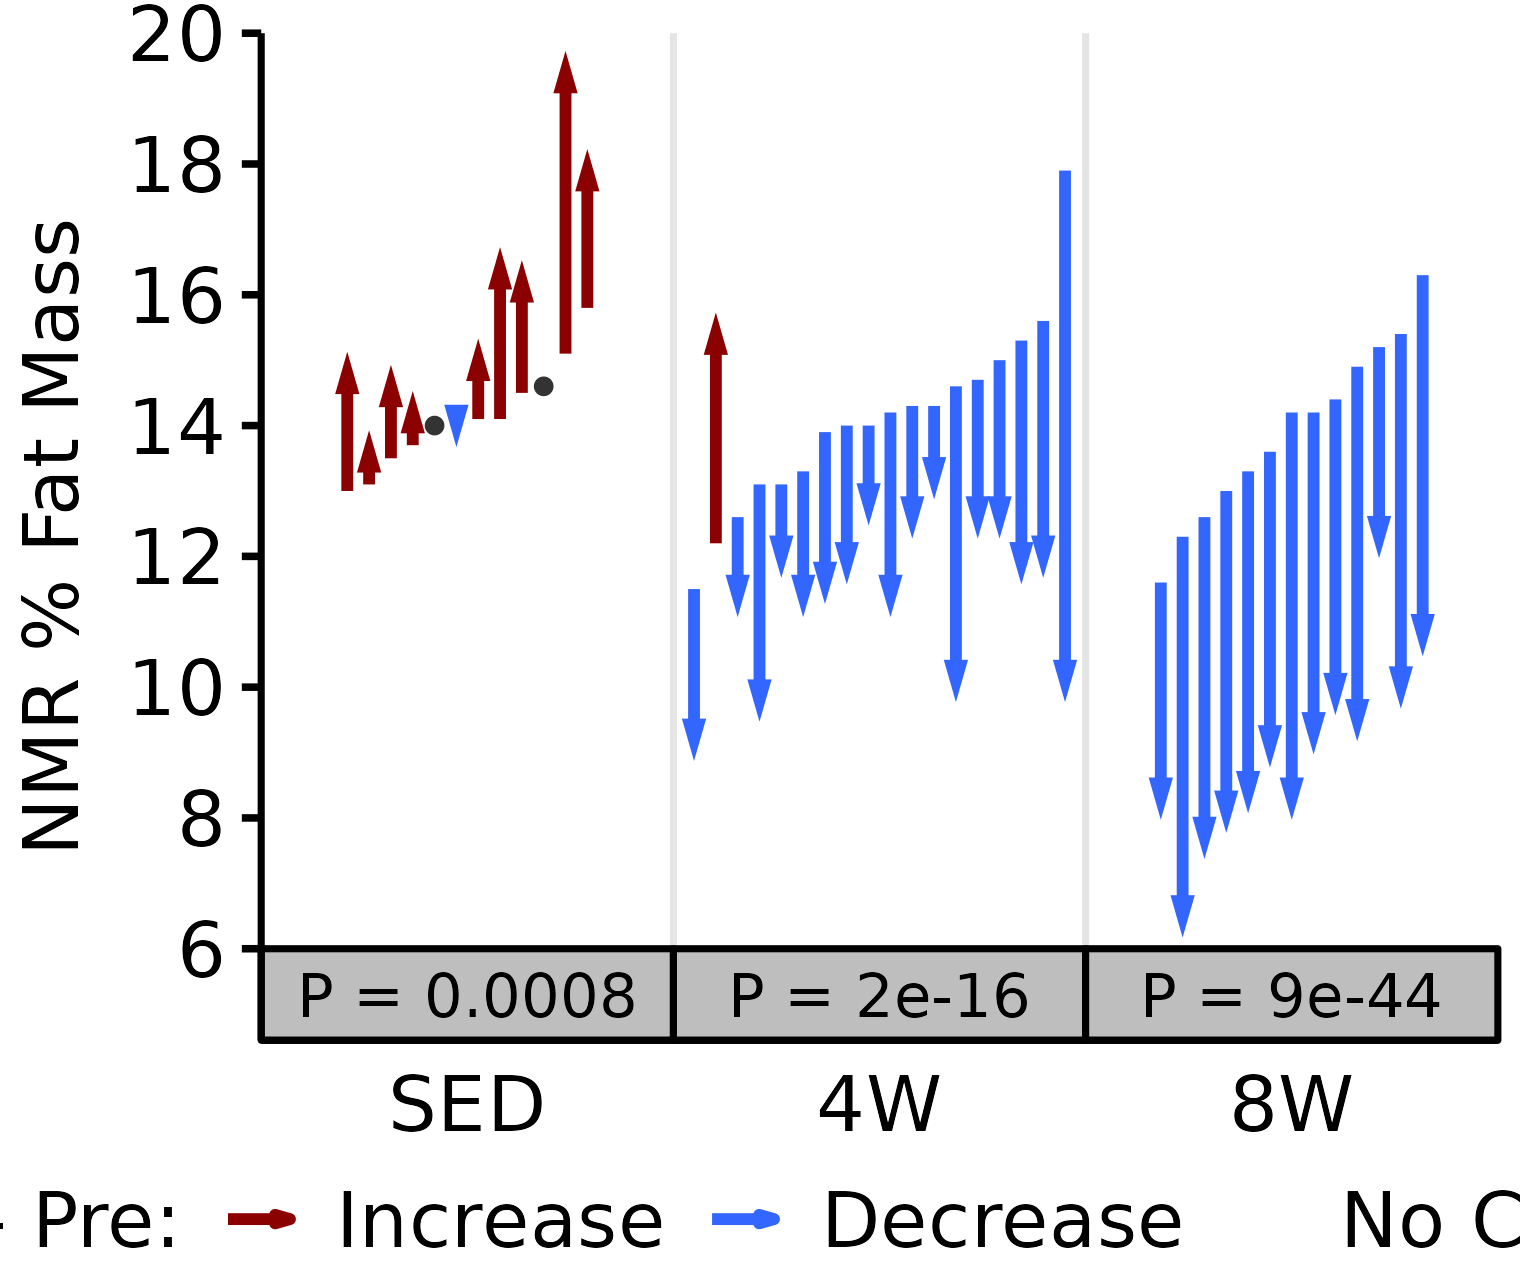
18M Female
# 18M Female NMR % Fat
plot_pre_post(x = filter(NMR, age == "18M", sex == "Female"),
              pre = "pre_fat_pct", post = "post_fat_pct",
              stats = filter(PRE_POST_STATS, response == "NMR % Fat",
                             age == "18M", sex == "Female"),
              ymin = 12, ymax = 24) +
  scale_y_continuous(name = "NMR % Fat Mass",
                     breaks = seq(12, 24, 2),
                     expand = expansion(mult = c(0, 5e-3)))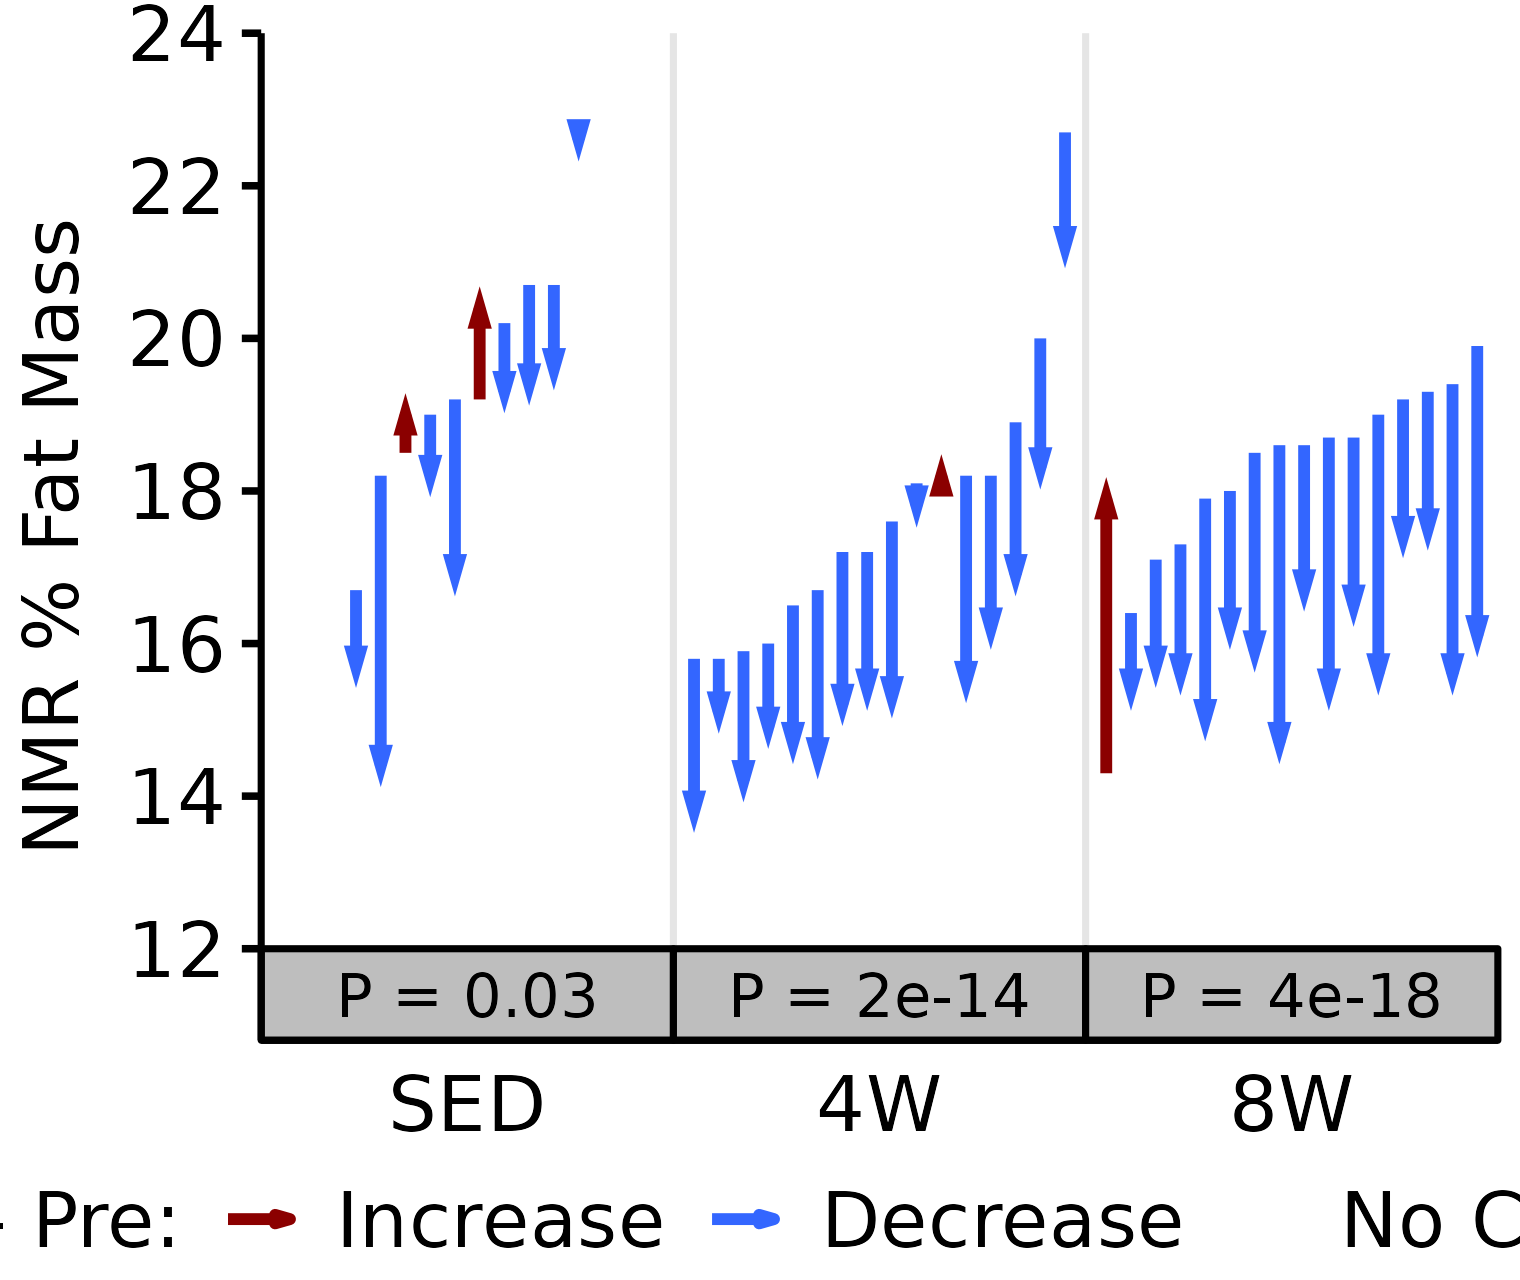
18M Male
# 18M Male NMR % Fat
plot_pre_post(x = filter(NMR, age == "18M", sex == "Male"),
              pre = "pre_fat_pct", post = "post_fat_pct",
              stats = filter(PRE_POST_STATS, response == "NMR % Fat",
                             age == "18M", sex == "Male"),
              ymin = 10, ymax = 22) +
  scale_y_continuous(name = "NMR % Fat Mass",
                     breaks = seq(10, 22, 2),
                     expand = expansion(mult = c(0, 5e-3)))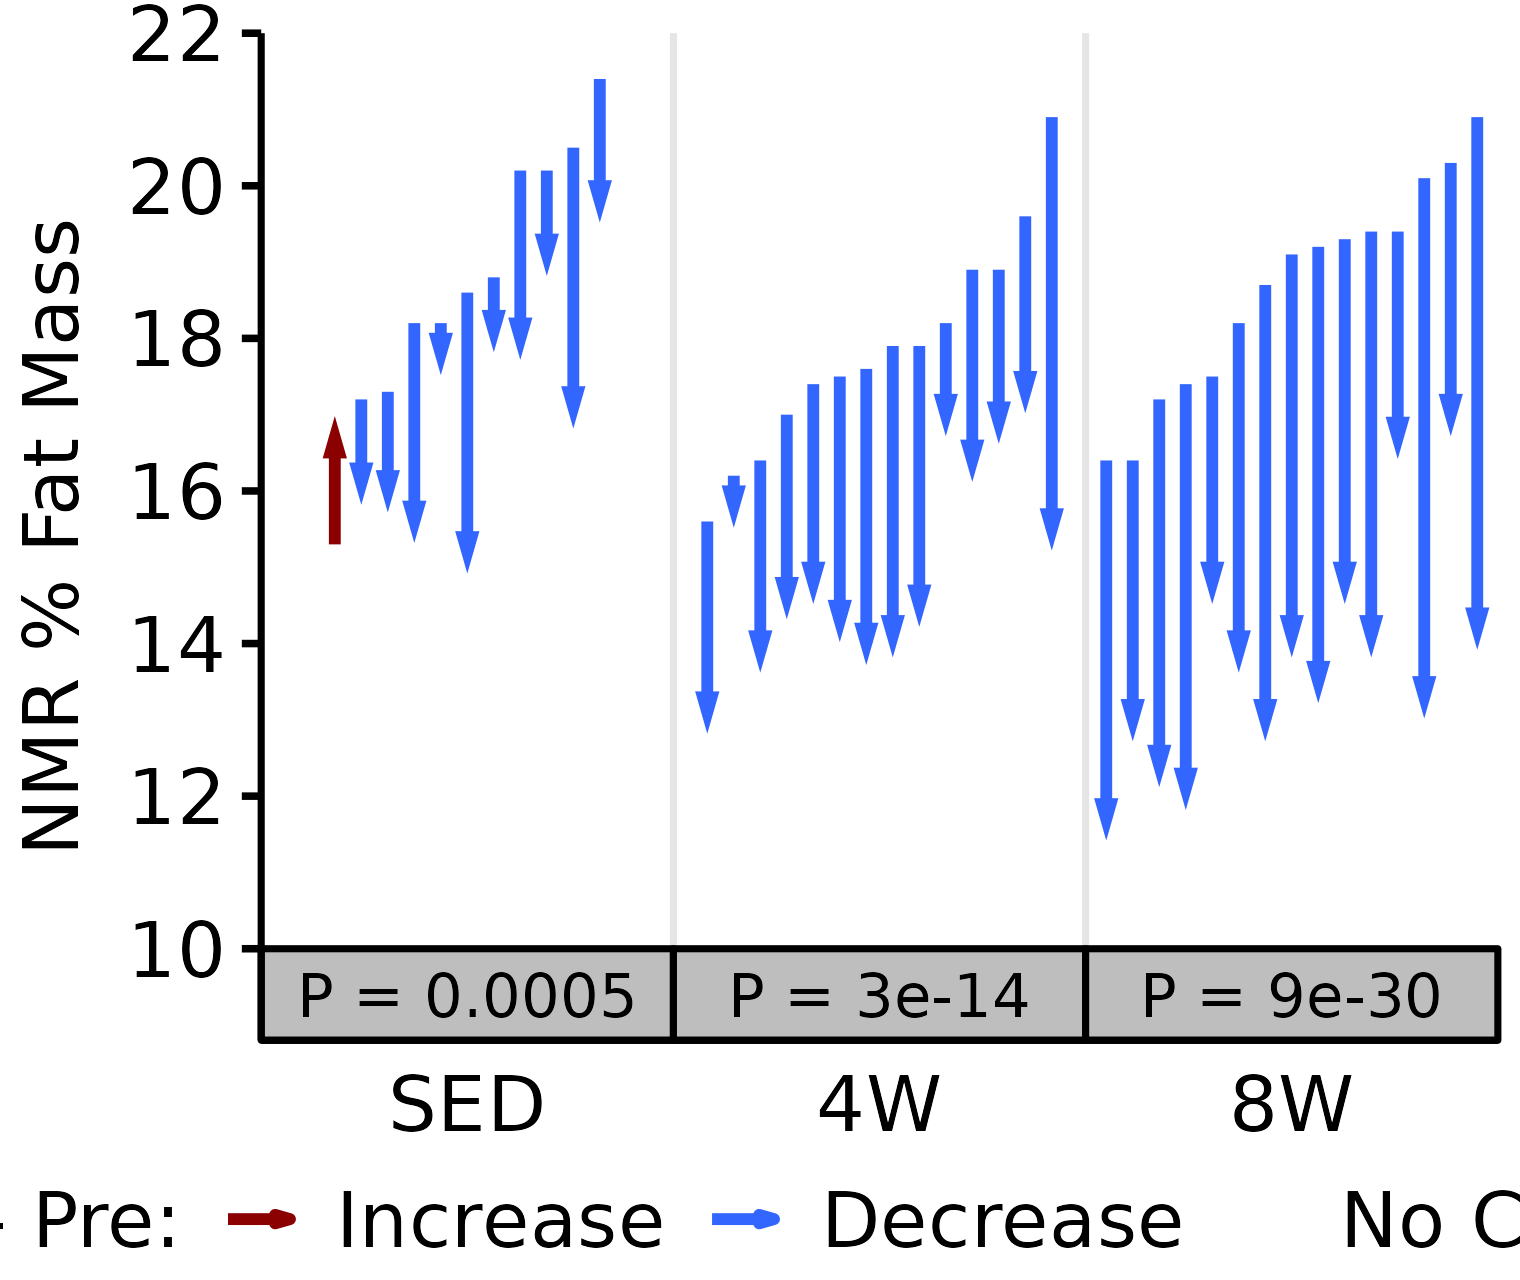
NMR % Lean
Lean mass (g) recorded via NMR divided by the body mass (g) recorded on the same day and then multiplied by 100%.
6M Female
# 6M Female NMR % Lean
plot_pre_post(x = filter(NMR, age == "6M", sex == "Female"),
              pre = "pre_lean_pct", post = "post_lean_pct",
              stats = filter(PRE_POST_STATS, response == "NMR % Lean",
                             age == "6M", sex == "Female"),
              ymin = 50, ymax = 64) +
  scale_y_continuous(name = "NMR % Lean Mass",
                     breaks = seq(50, 64, 2),
                     expand = expansion(mult = c(0, 5e-3)))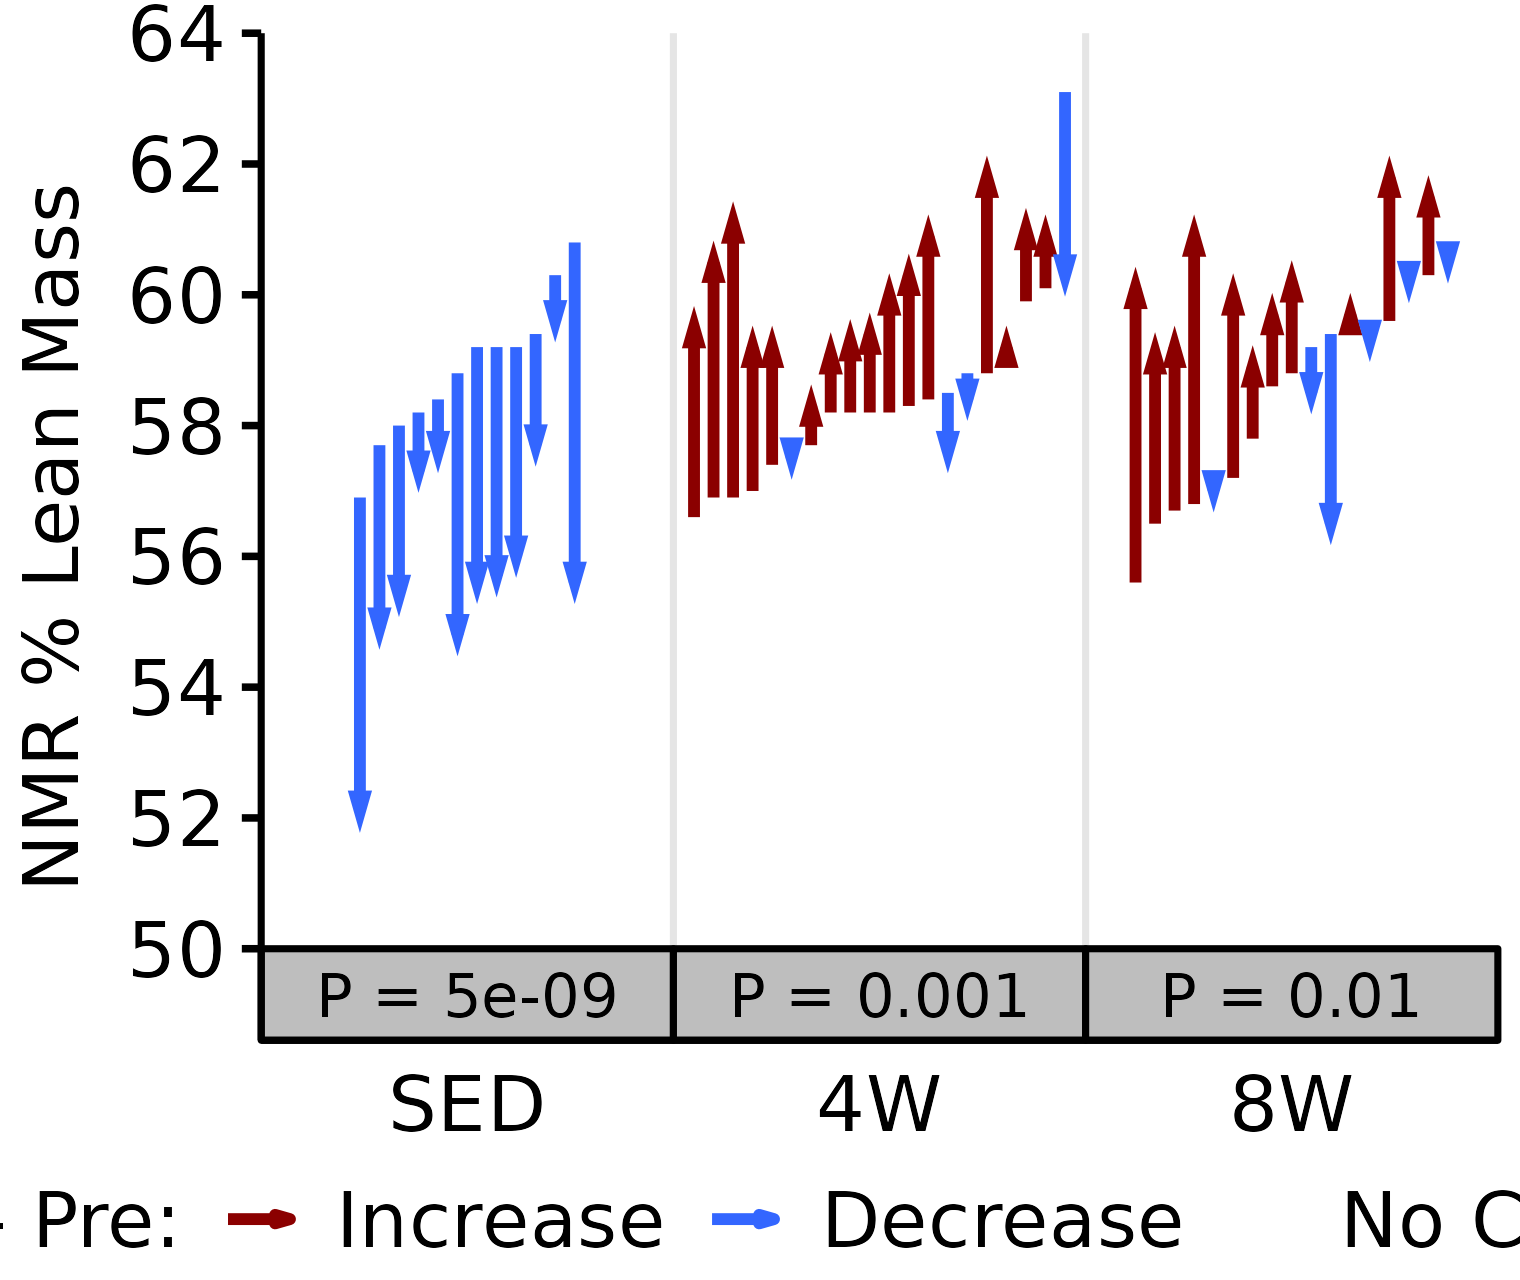
6M Male
# 6M Male NMR % Lean
plot_pre_post(x = filter(NMR, age == "6M", sex == "Male"),
              pre = "pre_lean_pct", post = "post_lean_pct",
              stats = filter(PRE_POST_STATS, response == "NMR % Lean",
                             age == "6M", sex == "Male"),
              ymin = 52, ymax = 64) +
  scale_y_continuous(name = "NMR % Lean Mass",
                     breaks = seq(52, 64, 2),
                     expand = expansion(mult = c(0, 5e-3)))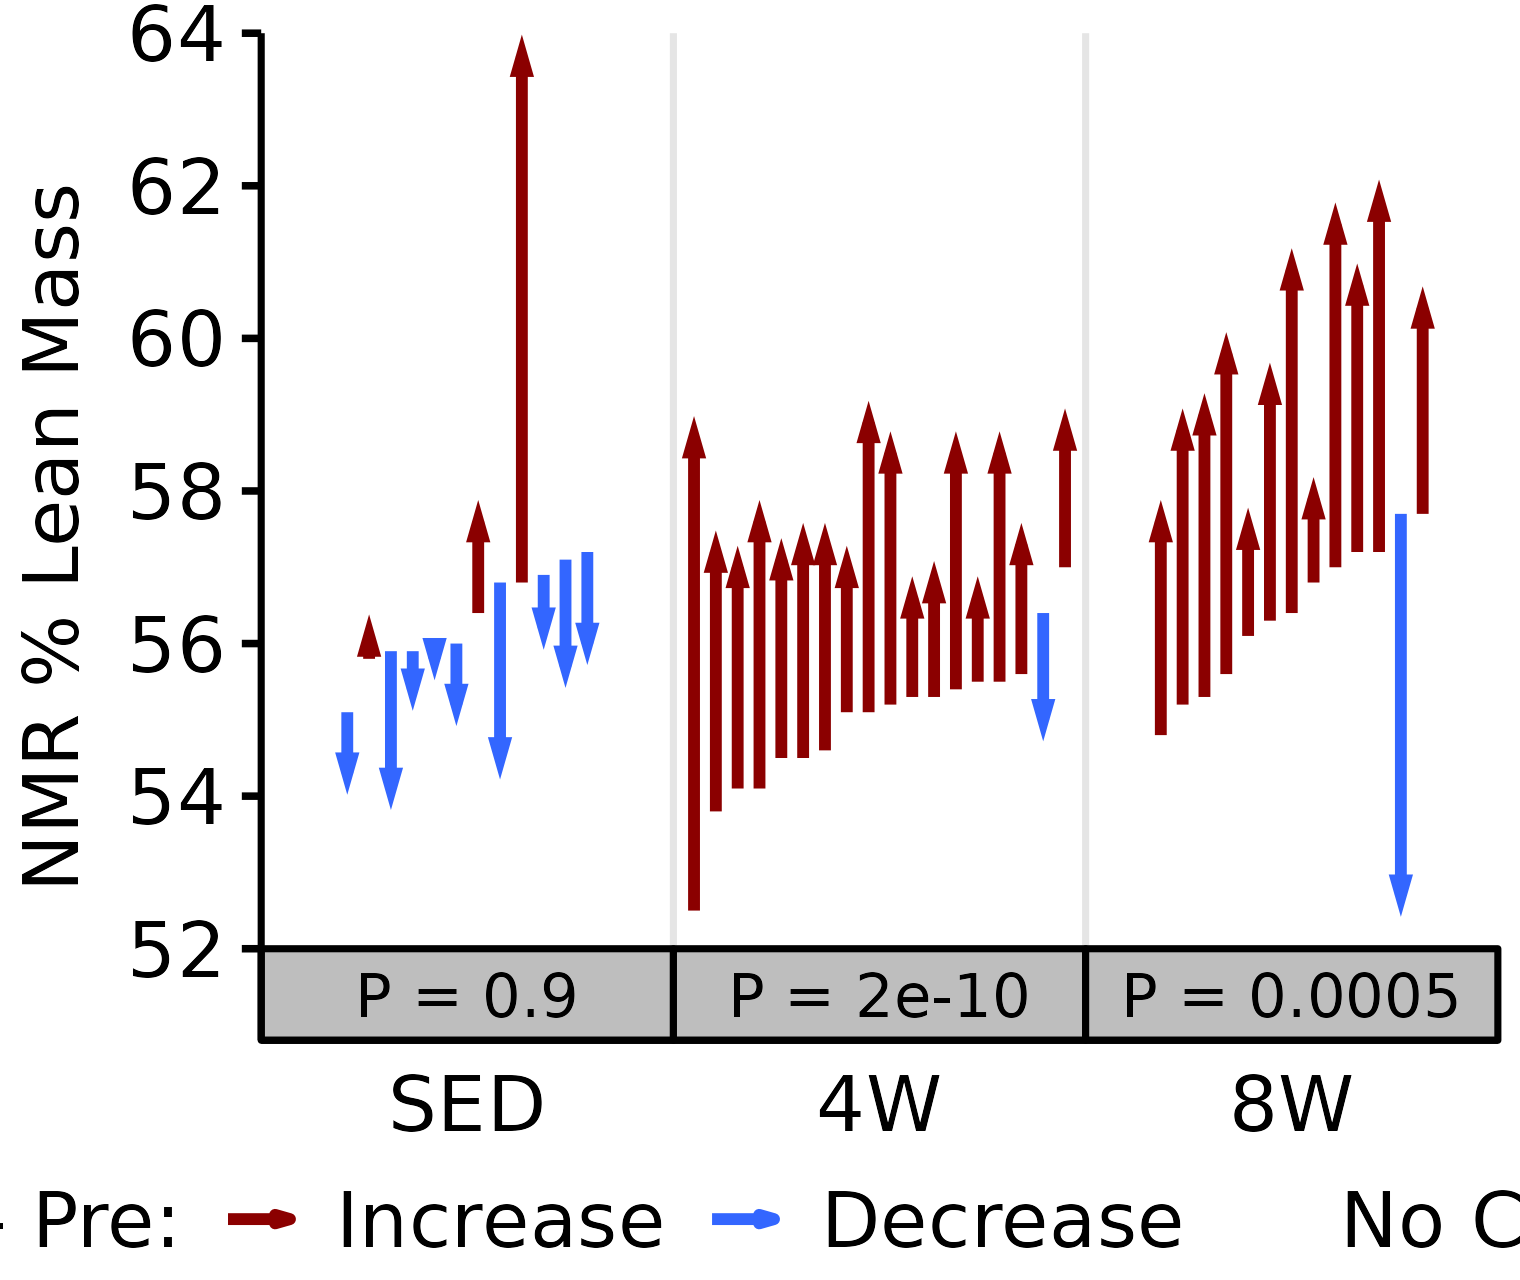
18M Female
# 18M Female NMR % Lean
plot_pre_post(x = filter(NMR, age == "18M", sex == "Female"),
              pre = "pre_lean_pct", post = "post_lean_pct",
              stats = filter(PRE_POST_STATS, response == "NMR % Lean",
                             age == "18M", sex == "Female"),
              ymin = 50, ymax = 60) +
  scale_y_continuous(name = "NMR % Lean Mass",
                     breaks = seq(50, 60, 2),
                     expand = expansion(mult = c(0, 5e-3)))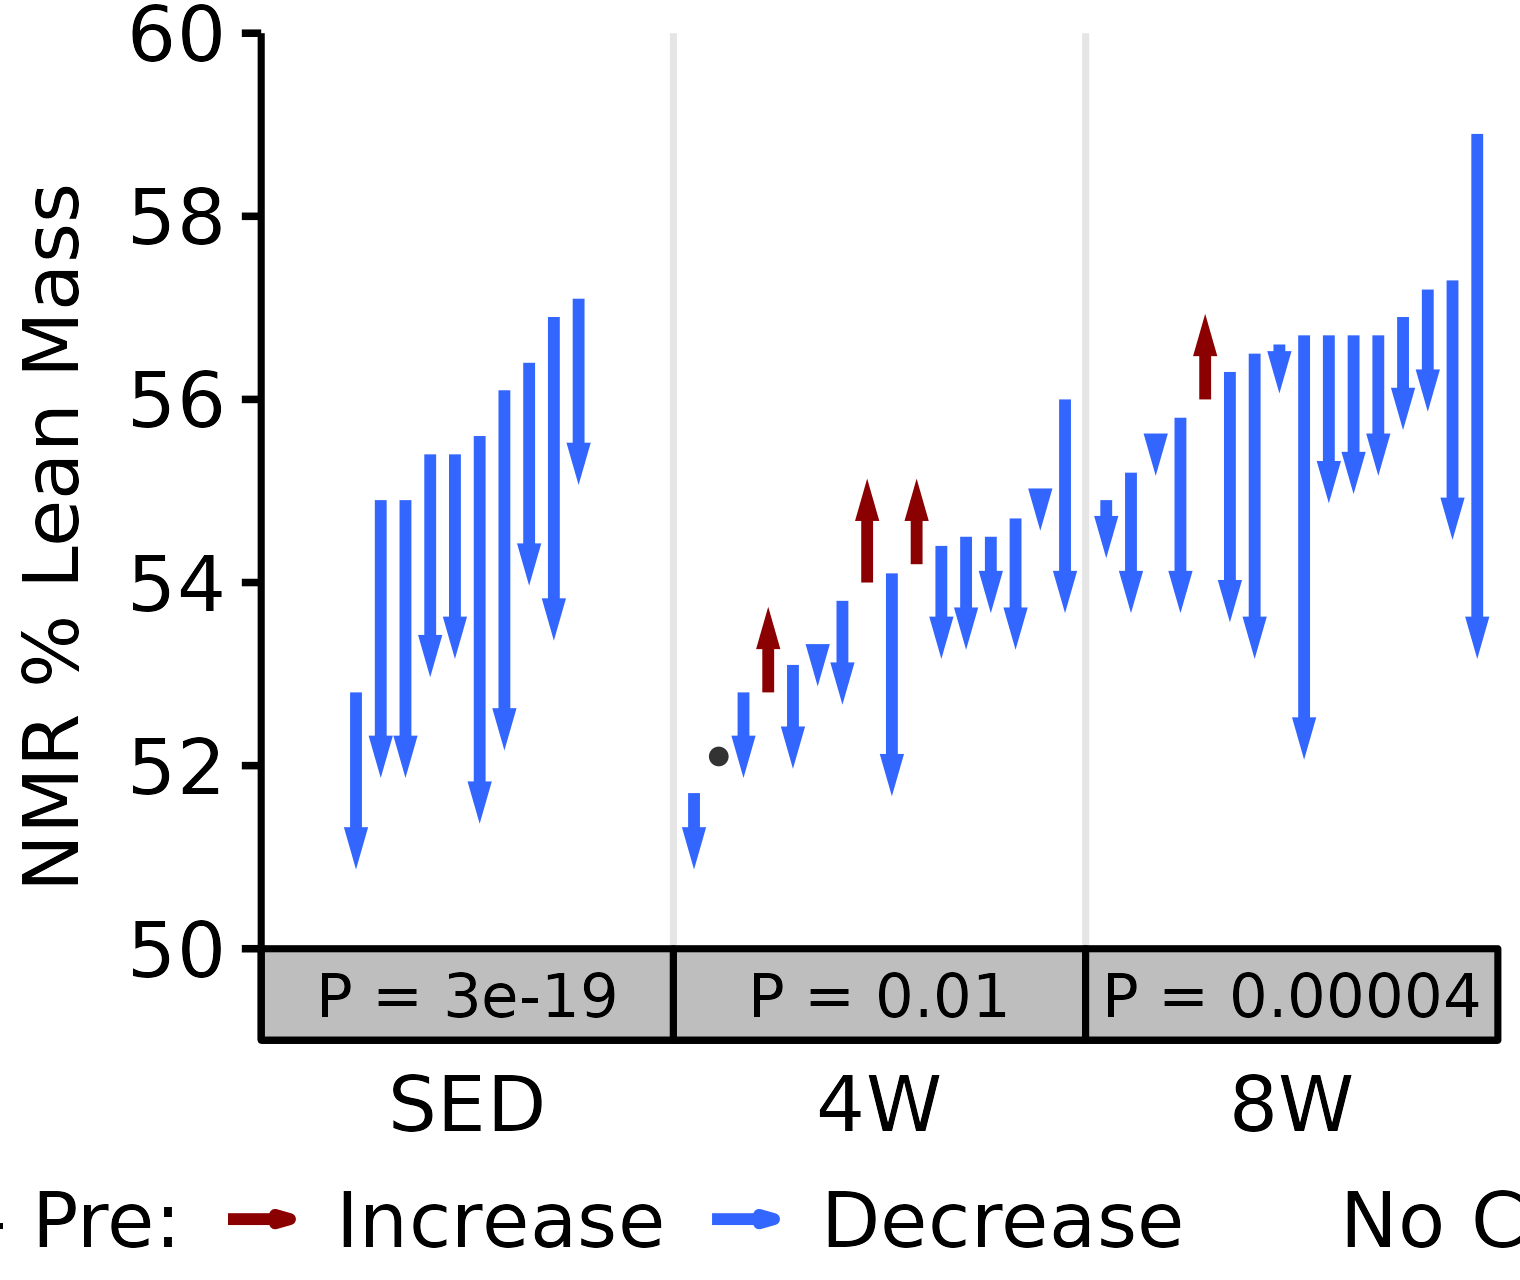
18M Male
# 18M Male NMR % Lean
plot_pre_post(x = filter(NMR, age == "18M", sex == "Male"),
              pre = "pre_lean_pct", post = "post_lean_pct",
              stats = filter(PRE_POST_STATS, response == "NMR % Lean",
                             age == "18M", sex == "Male"),
              ymin = 48, ymax = 58) +
  scale_y_continuous(name = "NMR % Lean Mass",
                     breaks = seq(48, 58, 2),
                     expand = expansion(mult = c(0, 5e-3)))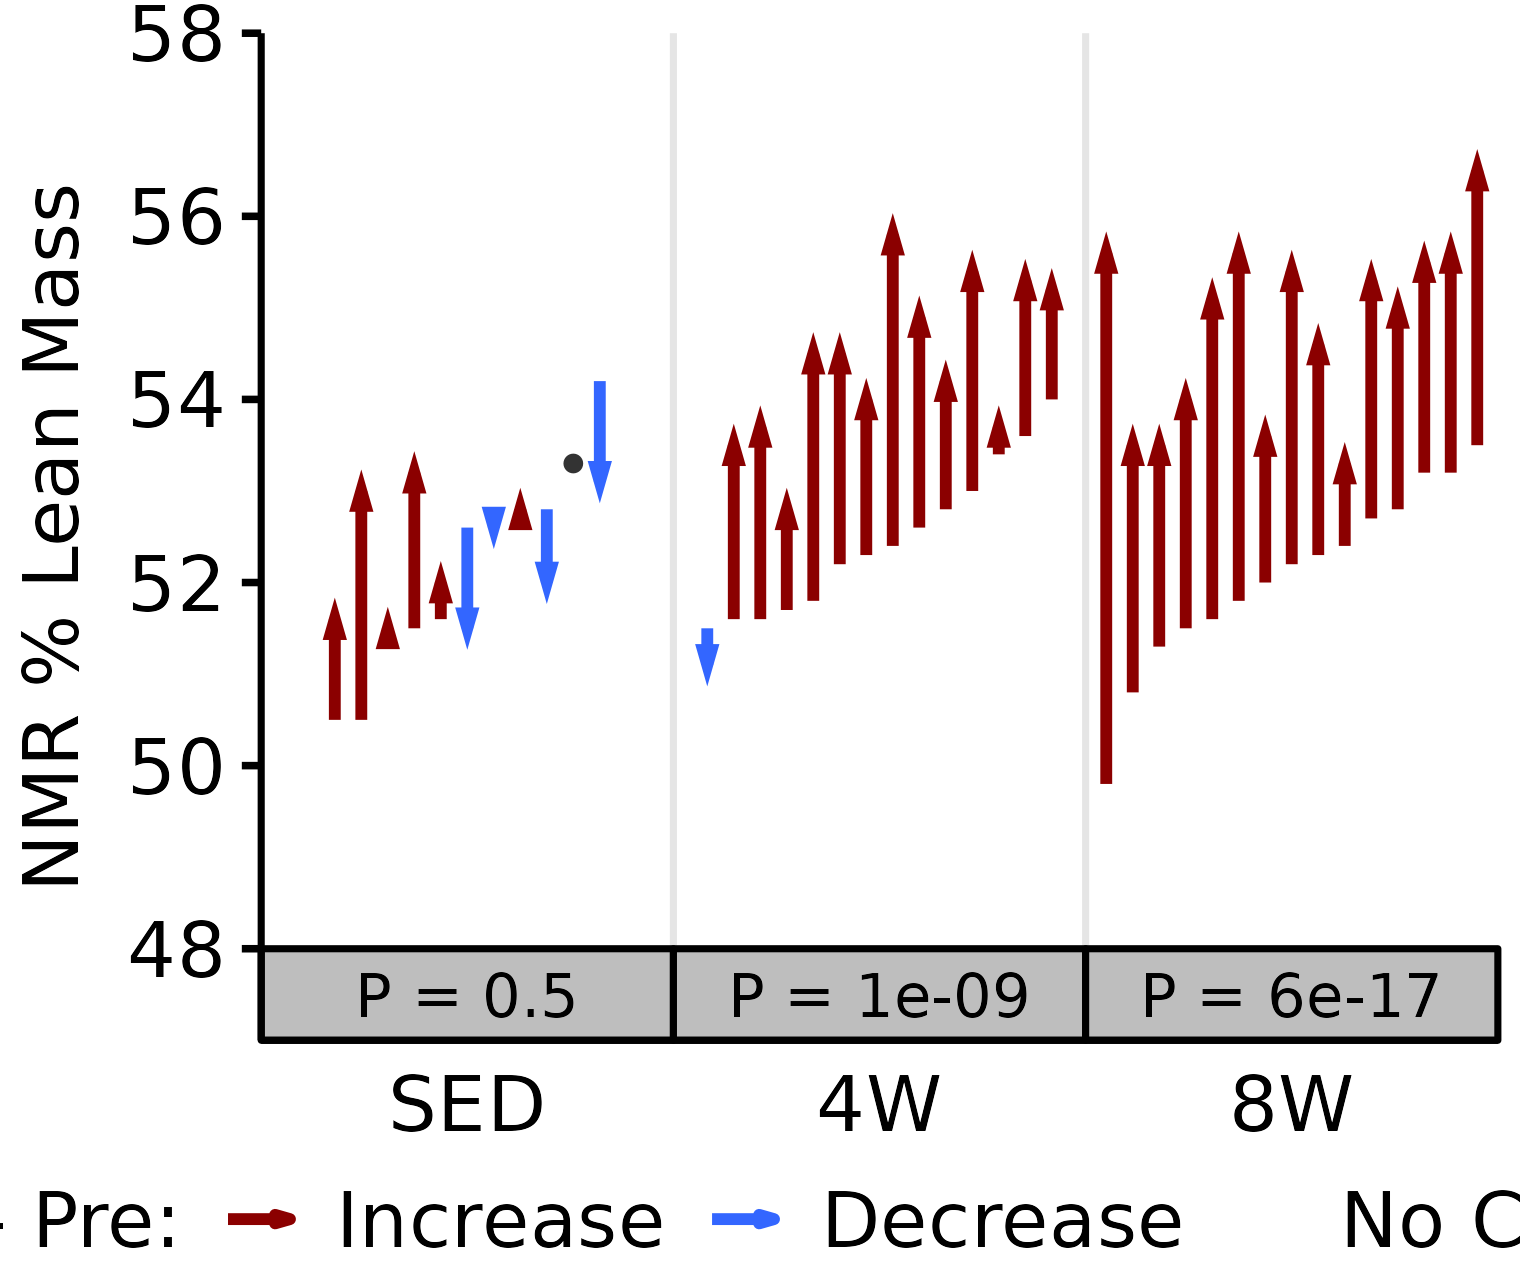
Absolute VO2max
Absolute VO\(_2\)max is calculated by multiplying relative VO\(_2\)max (\(mL \cdot kg^{-1} \cdot min^{-1}\)) by body mass (kg).
6M Female
# 6M Female Absolute VO2max
plot_pre_post(x = filter(VO2MAX, age == "6M", sex == "Female"),
              pre = "pre_vo2max_ml_min", post = "post_vo2max_ml_min",
              stats = filter(PRE_POST_STATS, response == "Absolute VO2max",
                             age == "6M", sex == "Female"),
              ymin = 10, ymax = 18) +
  scale_y_continuous(name = TeX("VO$_2$max (mL/min)"),
                     breaks = seq(10, 18, 2),
                     expand = expansion(mult = c(0, 5e-3)))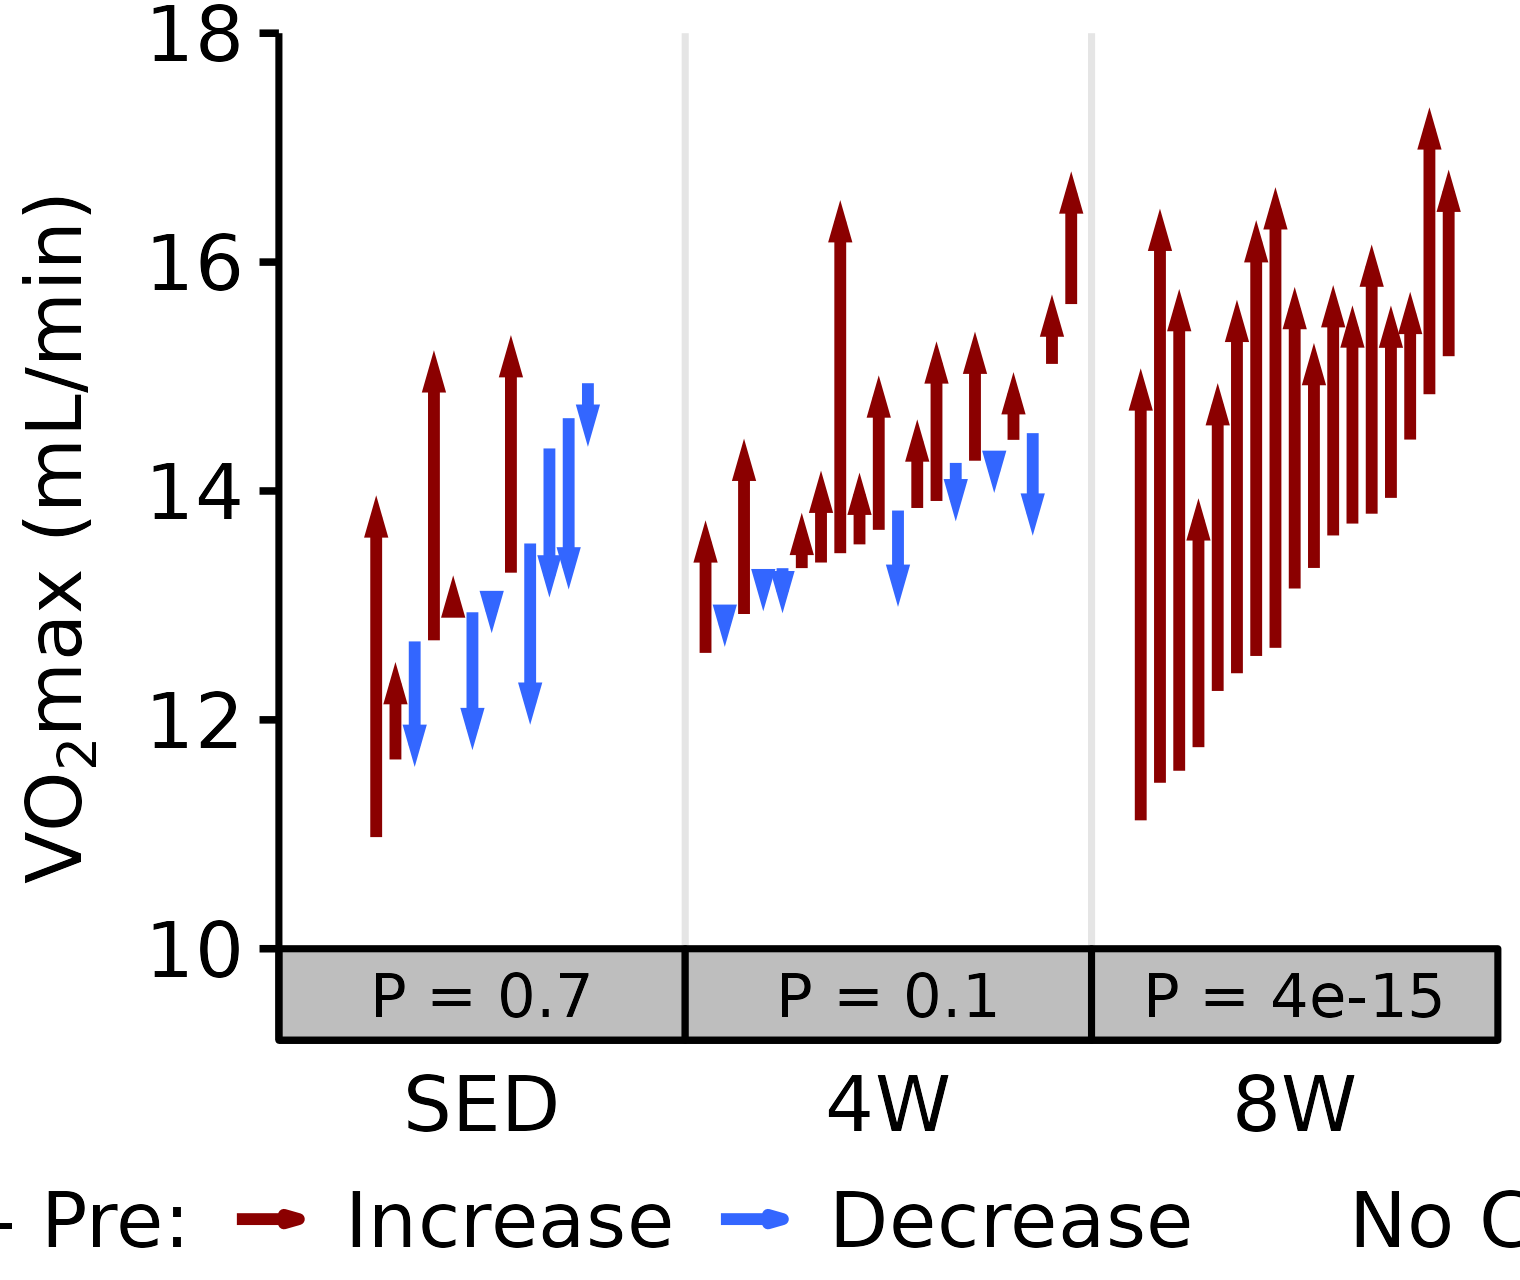
6M Male
# 6M Male Absolute VO2max
plot_pre_post(x = filter(VO2MAX, age == "6M", sex == "Male"),
              pre = "pre_vo2max_ml_min", post = "post_vo2max_ml_min",
              stats = filter(PRE_POST_STATS, response == "Absolute VO2max",
                             age == "6M", sex == "Male"),
              ymin = 16, ymax = 28) +
  scale_y_continuous(name = TeX("VO$_2$max (mL/min)"),
                     breaks = seq(16, 28, 3),
                     expand = expansion(mult = c(0, 5e-3)))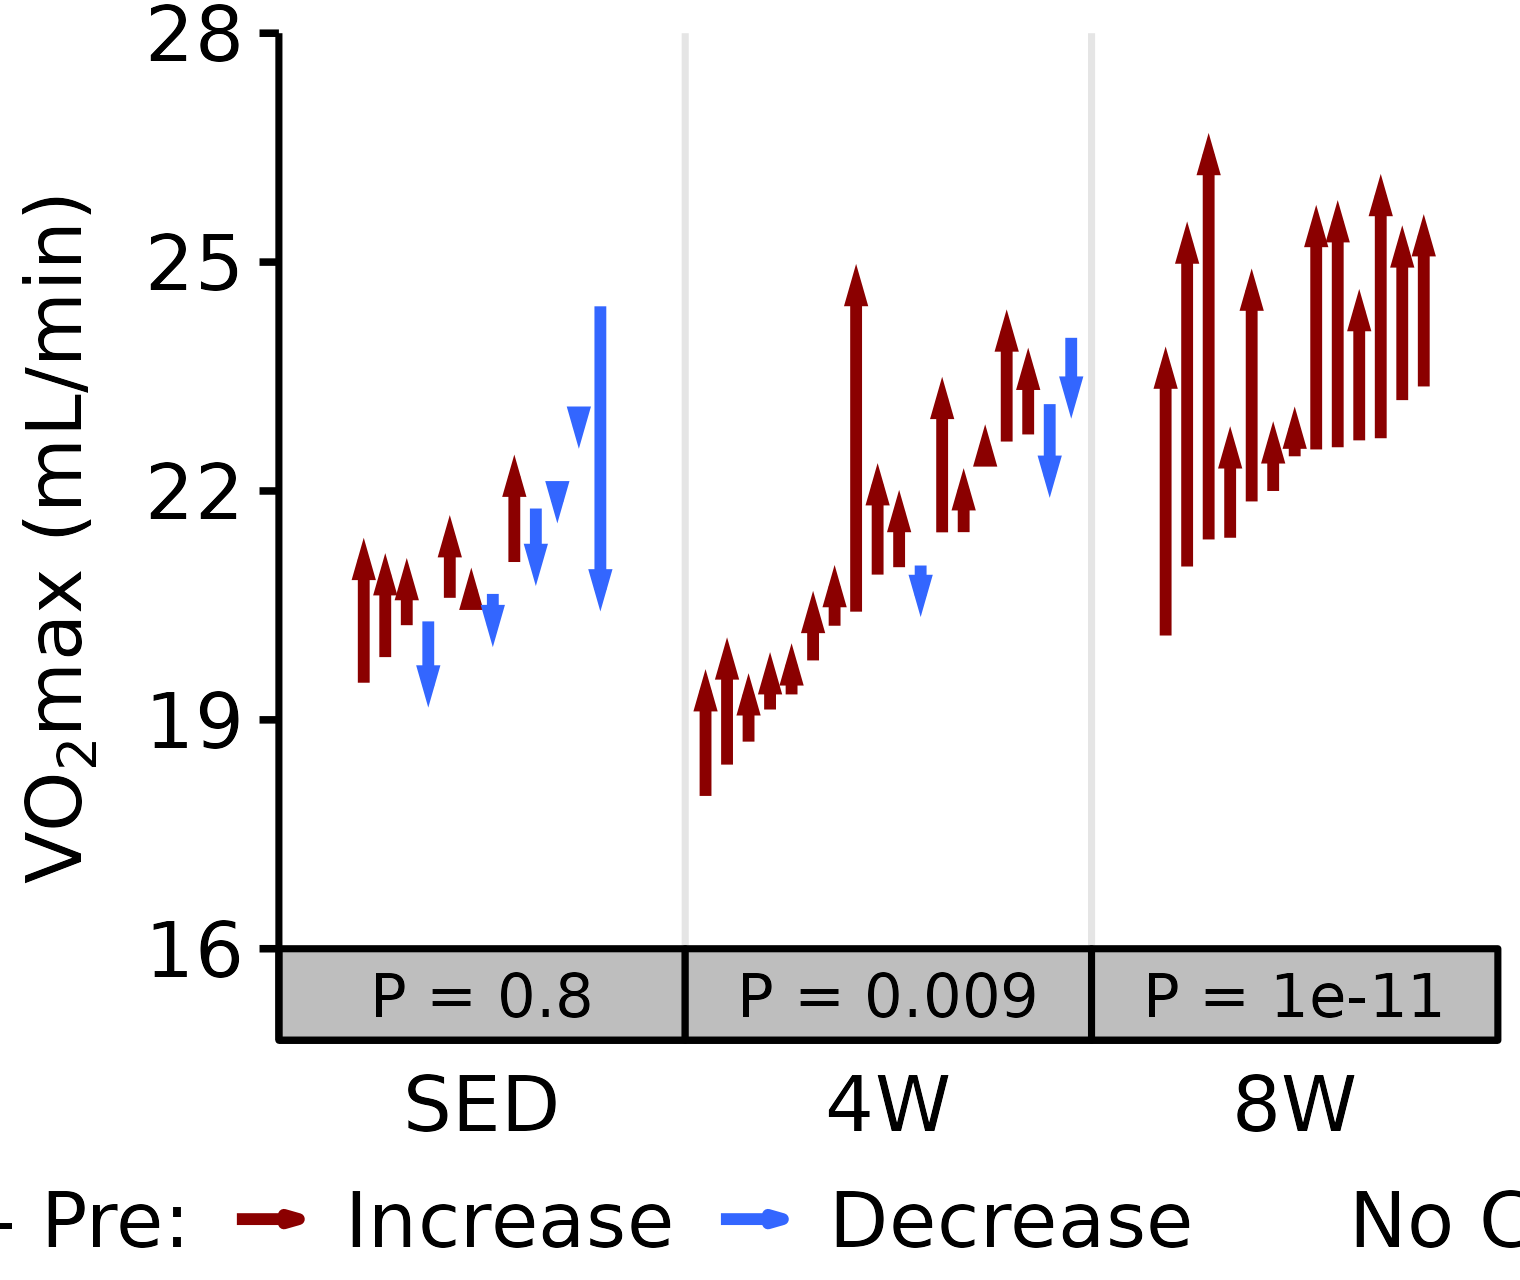
18M Female
# 18M Female Absolute VO2max
plot_pre_post(x = filter(VO2MAX, age == "18M", sex == "Female"),
              pre = "pre_vo2max_ml_min", post = "post_vo2max_ml_min",
              stats = filter(PRE_POST_STATS, response == "Absolute VO2max",
                             age == "18M", sex == "Female"),
              ymin = 10, ymax = 18) +
  scale_y_continuous(name = TeX("VO$_2$max (mL/min)"),
                     breaks = seq(10, 18, 2),
                     expand = expansion(mult = c(0, 5e-3)))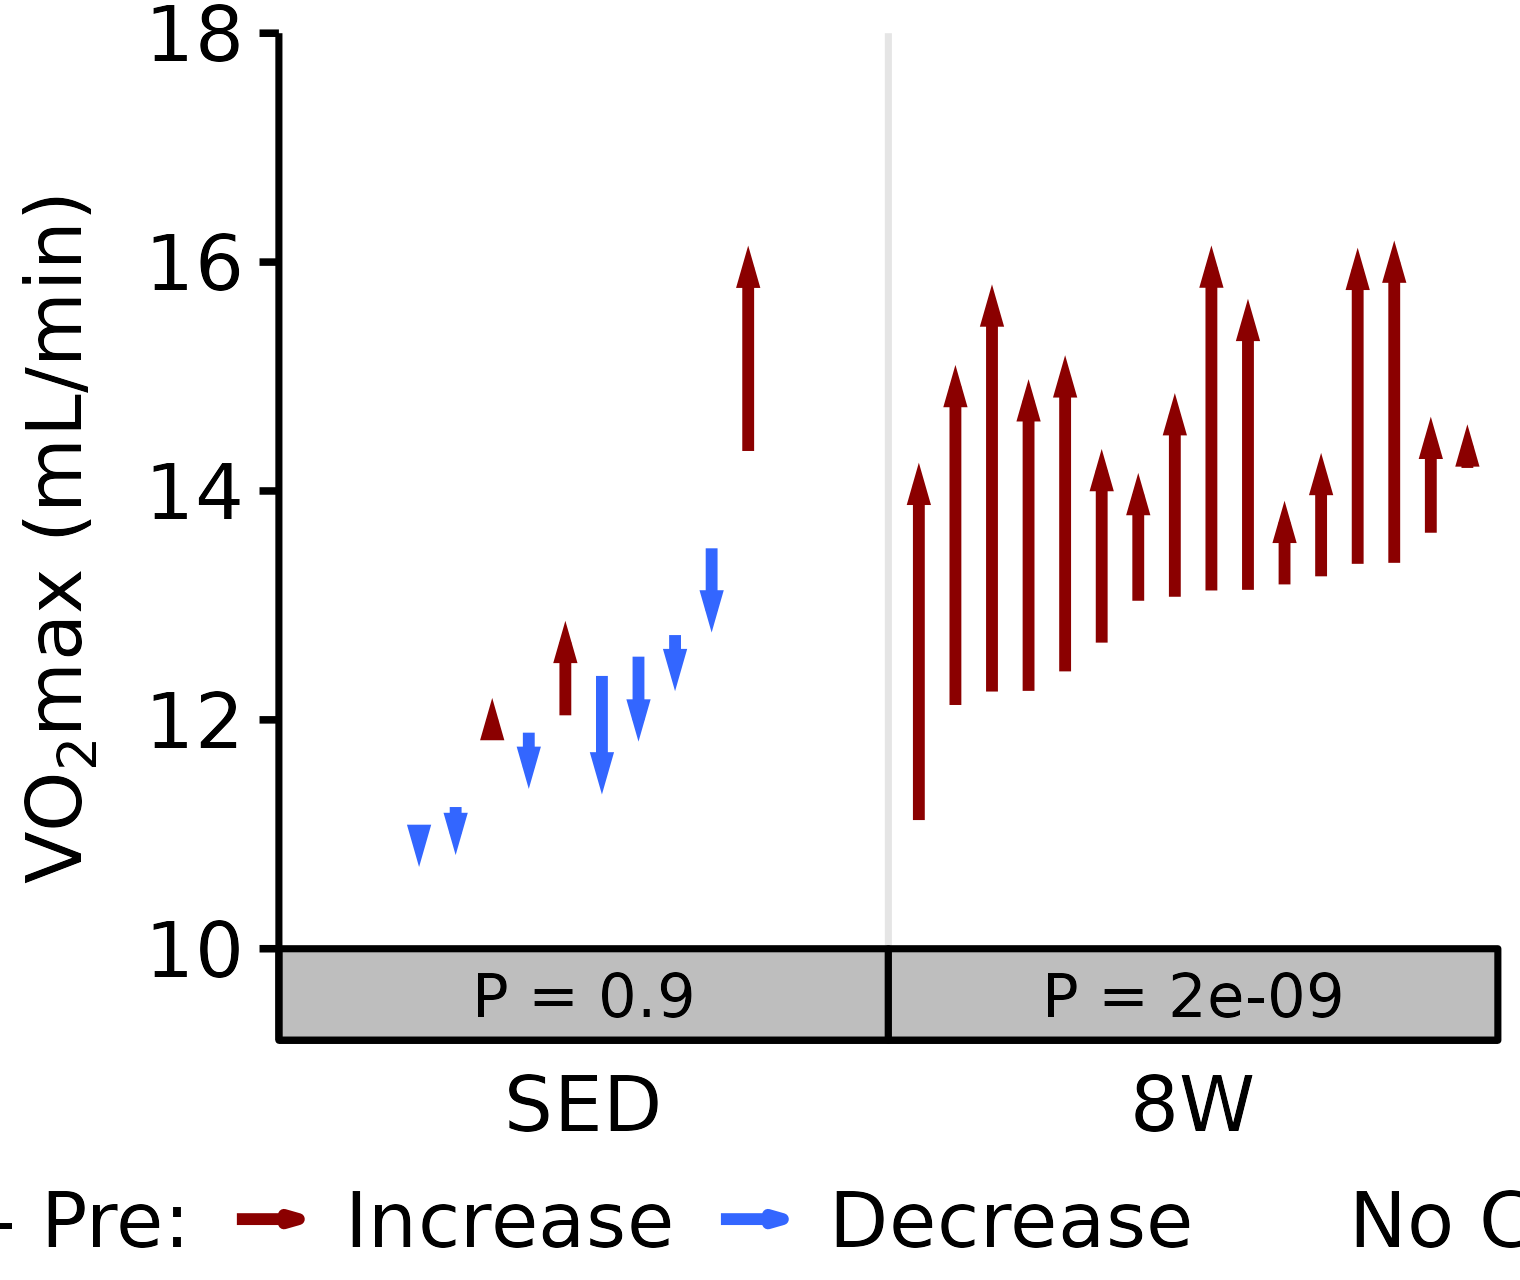
18M Male
# 18M Male Absolute VO2max
plot_pre_post(x = filter(VO2MAX, age == "18M", sex == "Male"),
              pre = "pre_vo2max_ml_min", post = "post_vo2max_ml_min",
              stats = filter(PRE_POST_STATS, response == "Absolute VO2max",
                             age == "18M", sex == "Male"),
              ymin = 16, ymax = 24) +
  scale_y_continuous(name = TeX("VO$_2$max (mL/min)"),
                     breaks = seq(16, 24, 2),
                     expand = expansion(mult = c(0, 5e-3)))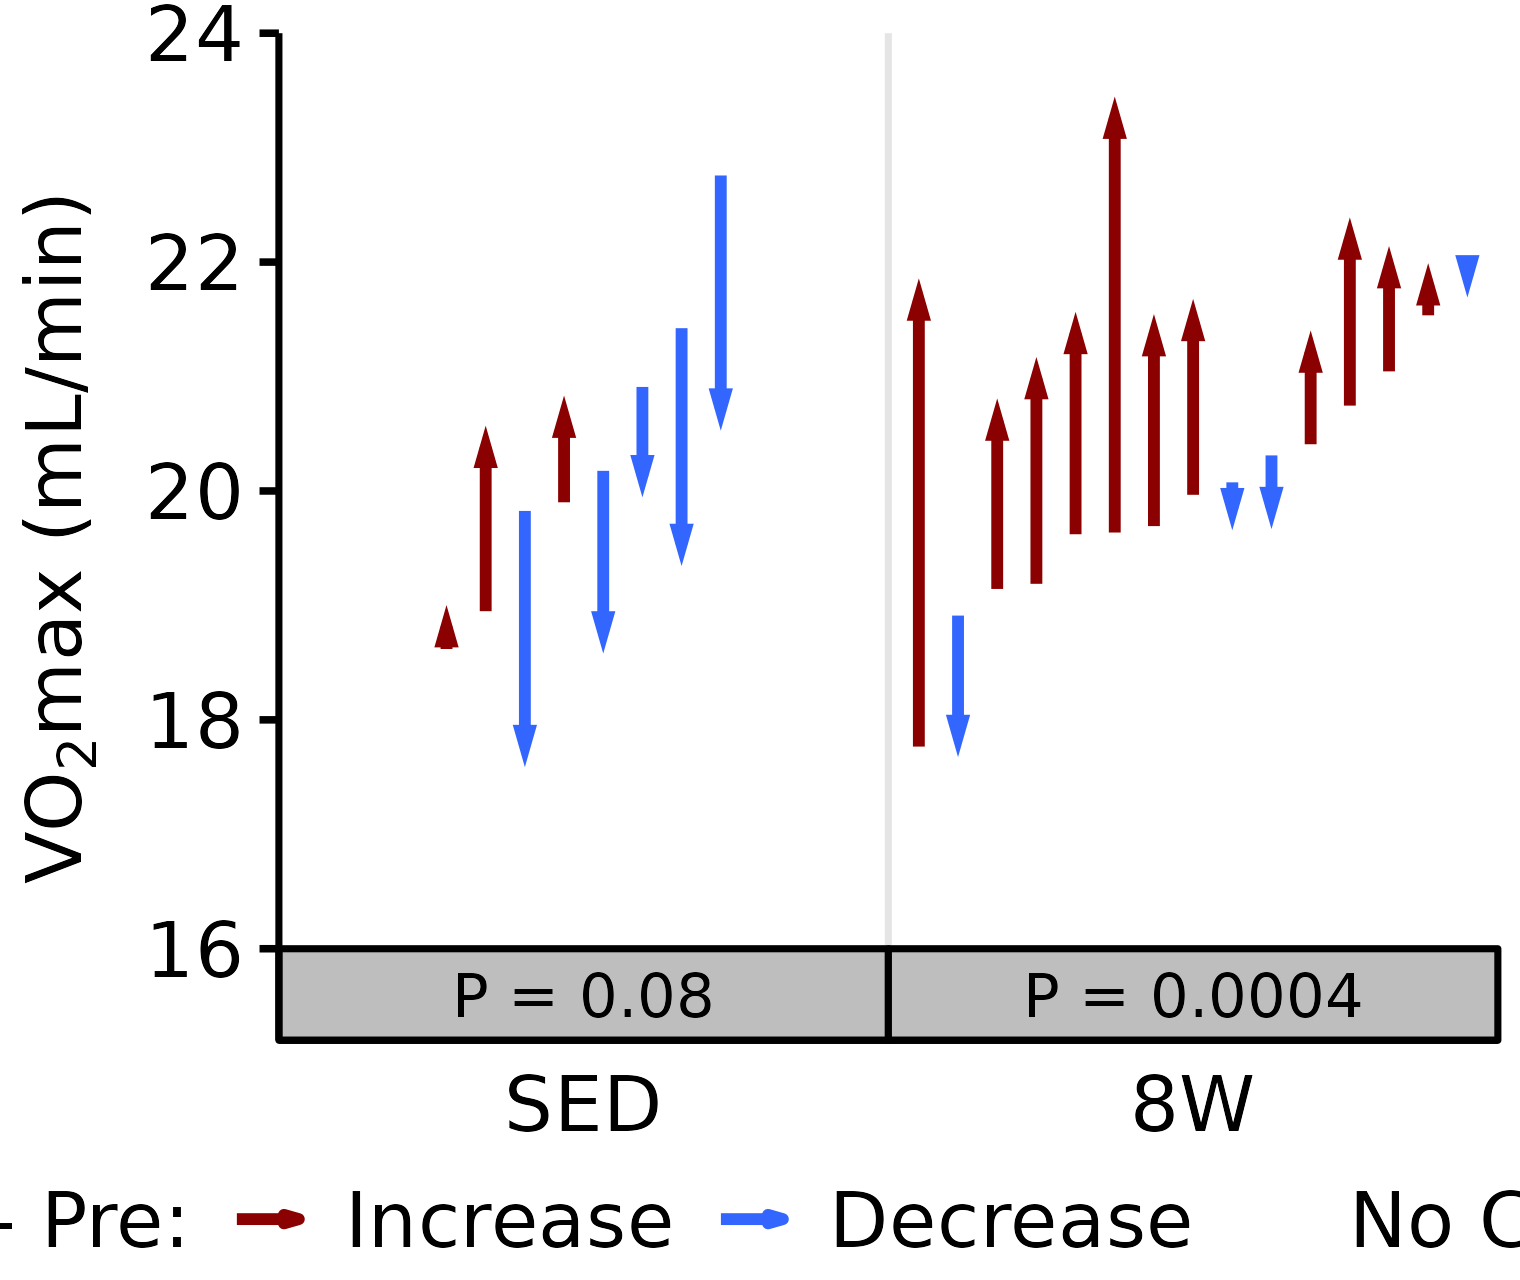
Relative VO2max
Relative VO\(_2\)max (mL/kg body mass/min).
6M Female
# 6M Female Relative VO2max
plot_pre_post(x = filter(VO2MAX, age == "6M", sex == "Female"),
              pre = "pre_vo2max_ml_kg_min", post = "post_vo2max_ml_kg_min",
              stats = filter(PRE_POST_STATS, response == "Relative VO2max",
                             age == "6M", sex == "Female"),
              ymin = 60, ymax = 90) +
  scale_y_continuous(name = TeX("VO$_2$max (mL/kg/min)"),
                     breaks = seq(60, 90, 5),
                     expand = expansion(mult = c(0, 5e-3)))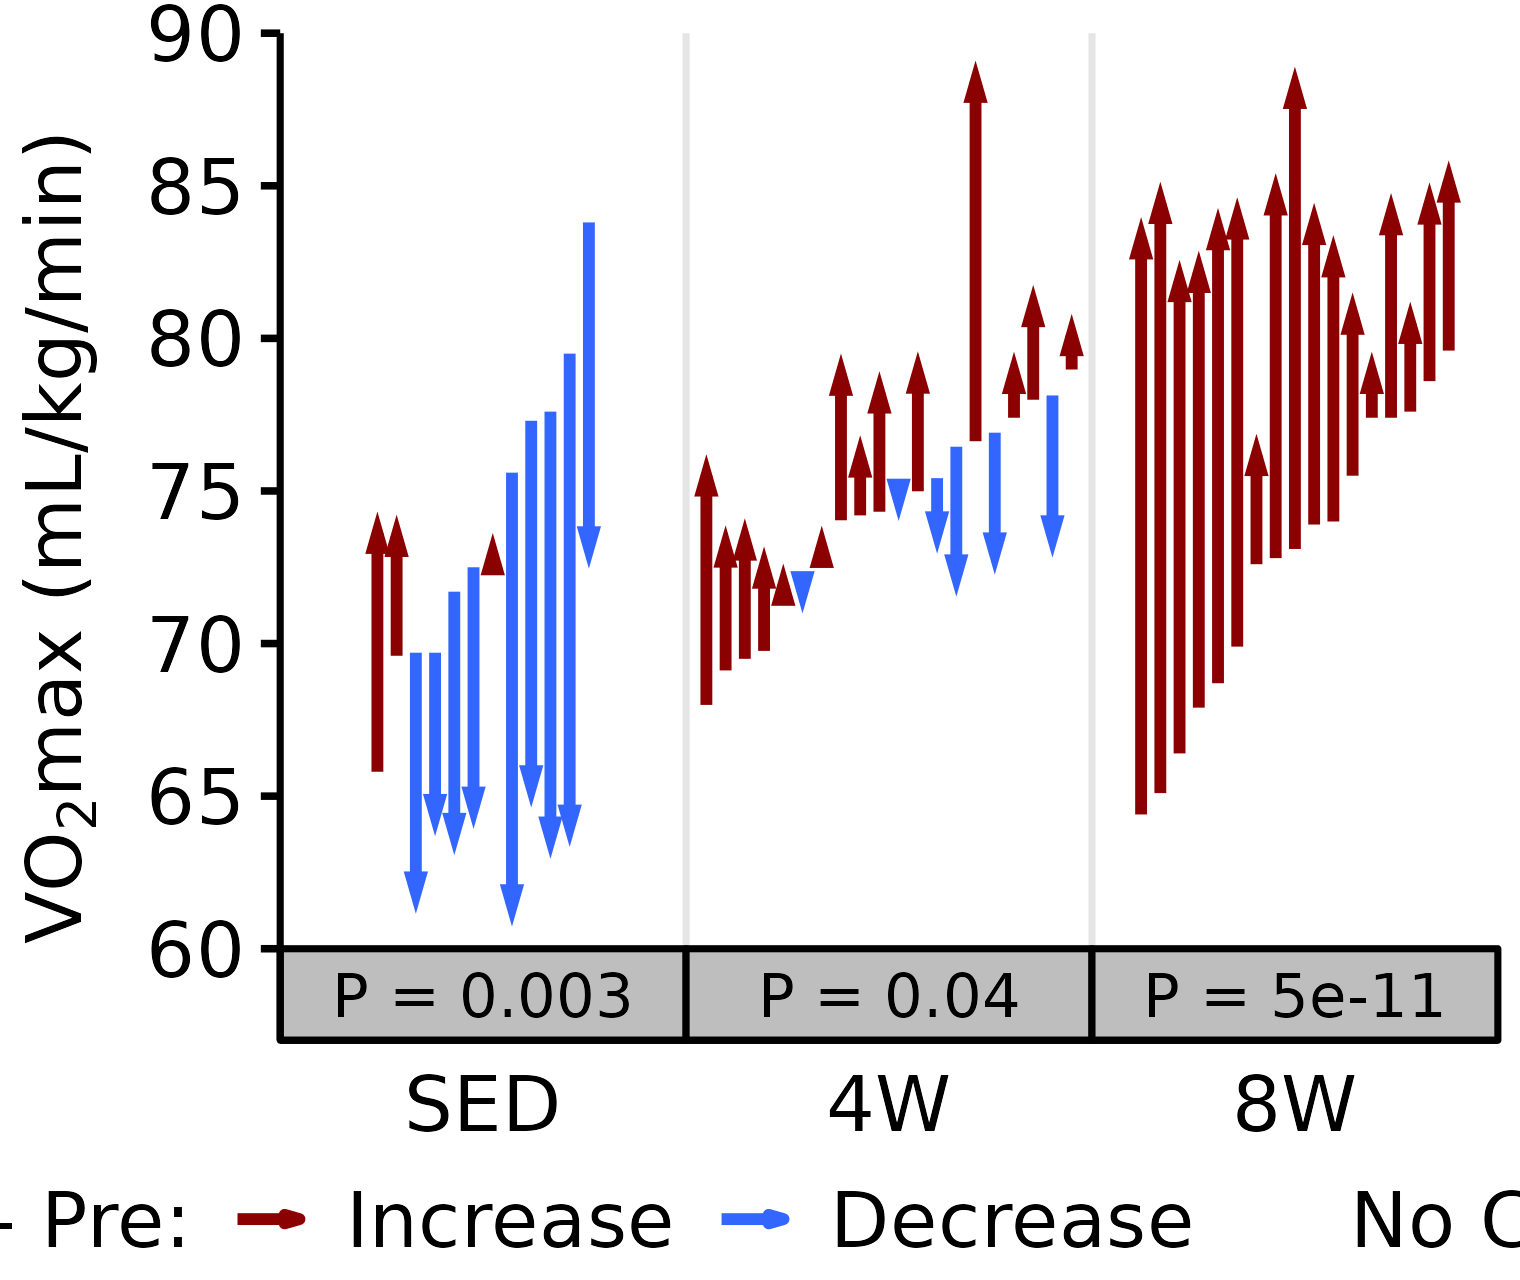
6M Male
# 6M Male Relative VO2max
plot_pre_post(x = filter(VO2MAX, age == "6M", sex == "Male"),
              pre = "pre_vo2max_ml_kg_min", post = "post_vo2max_ml_kg_min",
              stats = filter(PRE_POST_STATS, response == "Relative VO2max",
                             age == "6M", sex == "Male"),
              ymin = 50, ymax = 90) +
  scale_y_continuous(name = TeX("VO$_2$max (mL/kg/min)"),
                     breaks = seq(50, 90, 5),
                     expand = expansion(mult = c(0, 5e-3)))
18M Female
# 18M Female Relative VO2max
plot_pre_post(x = filter(VO2MAX, age == "18M", sex == "Female"),
              pre = "pre_vo2max_ml_kg_min", post = "post_vo2max_ml_kg_min",
              stats = filter(PRE_POST_STATS, response == "Relative VO2max",
                             age == "18M", sex == "Female"),
              ymin = 40, ymax = 75) +
  scale_y_continuous(name = TeX("VO$_2$max (mL/kg/min)"),
                     breaks = seq(40, 75, 5),
                     expand = expansion(mult = c(0, 5e-3)))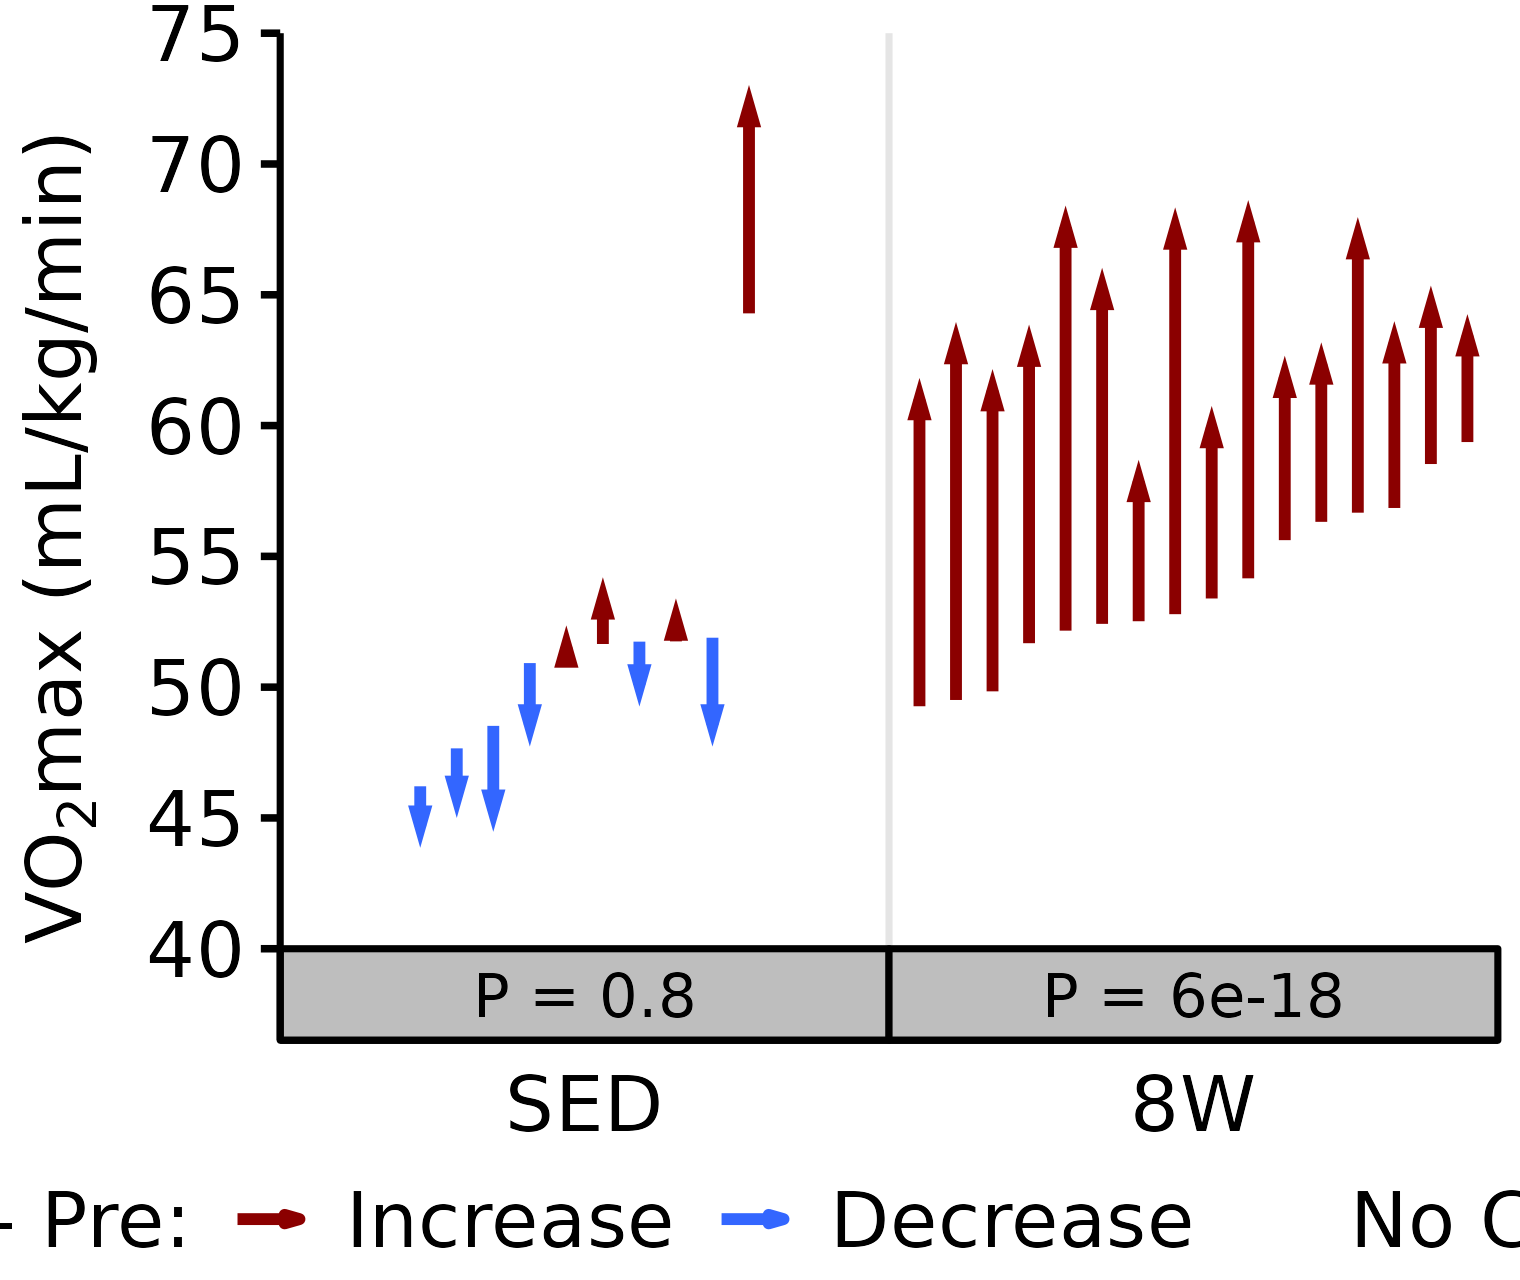
18M Male
# 18M Male Relative VO2max
plot_pre_post(x = filter(VO2MAX, age == "18M", sex == "Male"),
              pre = "pre_vo2max_ml_kg_min", post = "post_vo2max_ml_kg_min",
              stats = filter(PRE_POST_STATS, response == "Relative VO2max",
                             age == "18M", sex == "Male"),
              ymin = 40, ymax = 65) +
  scale_y_continuous(name = TeX("VO$_2$max (mL/kg/min)"),
                     breaks = seq(40, 65, 5),
                     expand = expansion(mult = c(0, 5e-3)))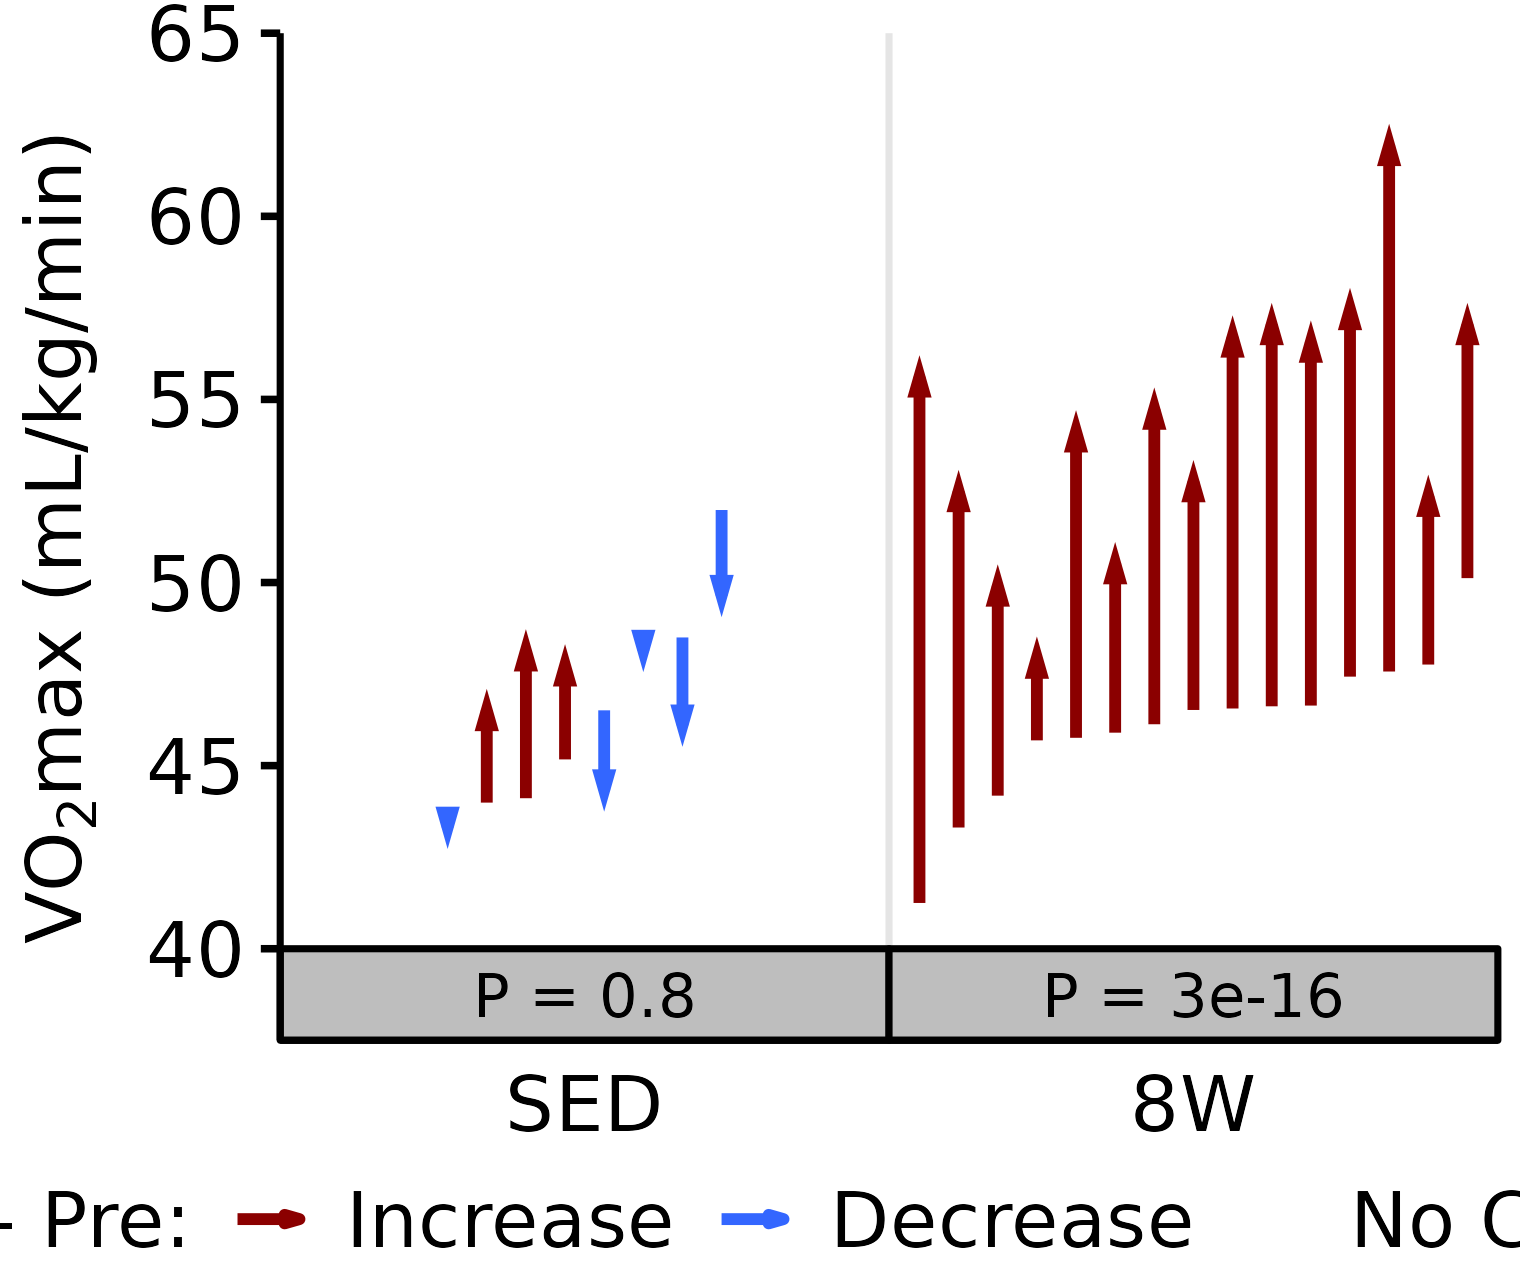
Maximum Run Speed
Maximum run speed (m/min) reached during the VO\(_2\)max test.
6M Female
# 6M Female max run speed
plot_pre_post(x = filter(VO2MAX, age == "6M", sex == "Female"),
              pre = "pre_speed_max", post = "post_speed_max",
              stats = filter(PRE_POST_STATS, response == "Maximum Run Speed",
                             age == "6M", sex == "Female"),
              ymin = 19.3, ymax = 37.8) +
  scale_y_continuous(name = "Maximum Run Speed (m/min)",
                     breaks = seq(19.8, 37.8, 3.6),
                     expand = expansion(mult = c(0, 5e-3)))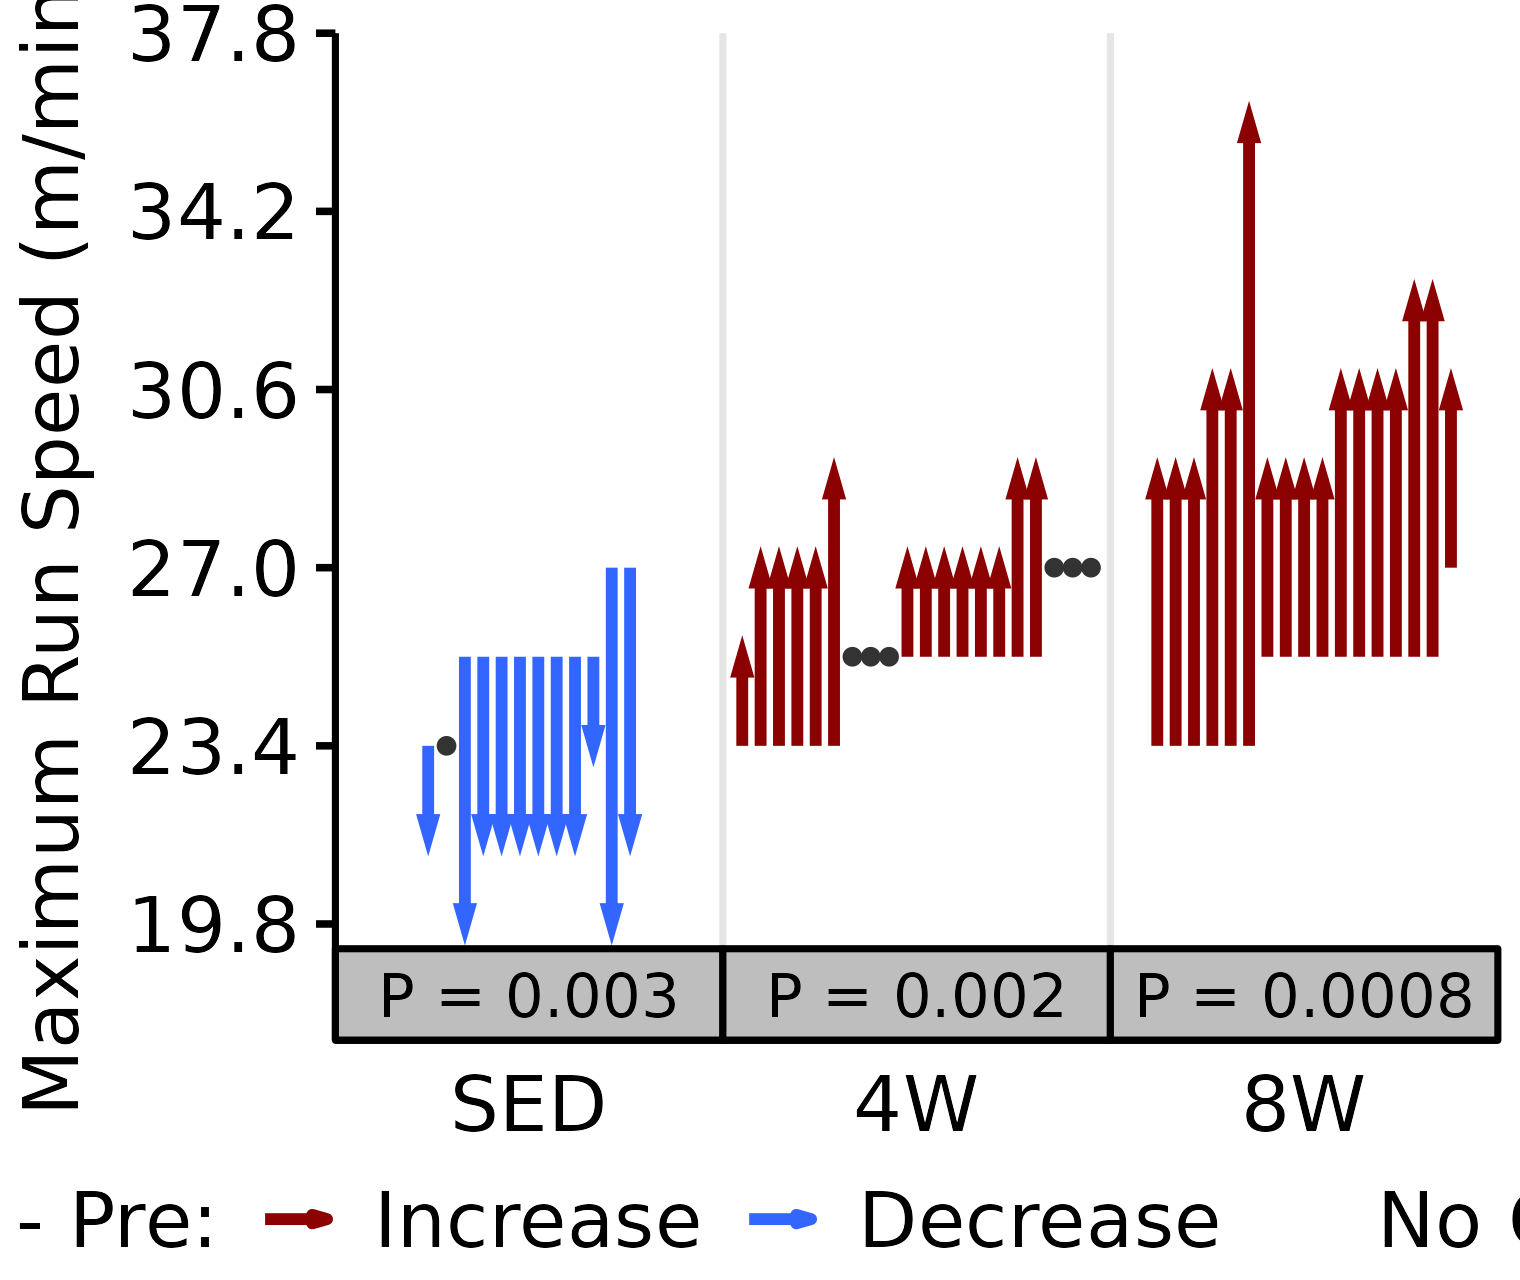
6M Male
# 6M Male max run speed
plot_pre_post(x = filter(VO2MAX, age == "6M", sex == "Male"),
              pre = "pre_speed_max", post = "post_speed_max",
              stats = filter(PRE_POST_STATS, response == "Maximum Run Speed",
                             age == "6M", sex == "Male"),
              ymin = 17.5, ymax = 36) +
  scale_y_continuous(name = "Maximum Run Speed (m/min)",
                     breaks = seq(18, 36, 3.6),
                     expand = expansion(mult = c(0, 5e-3)))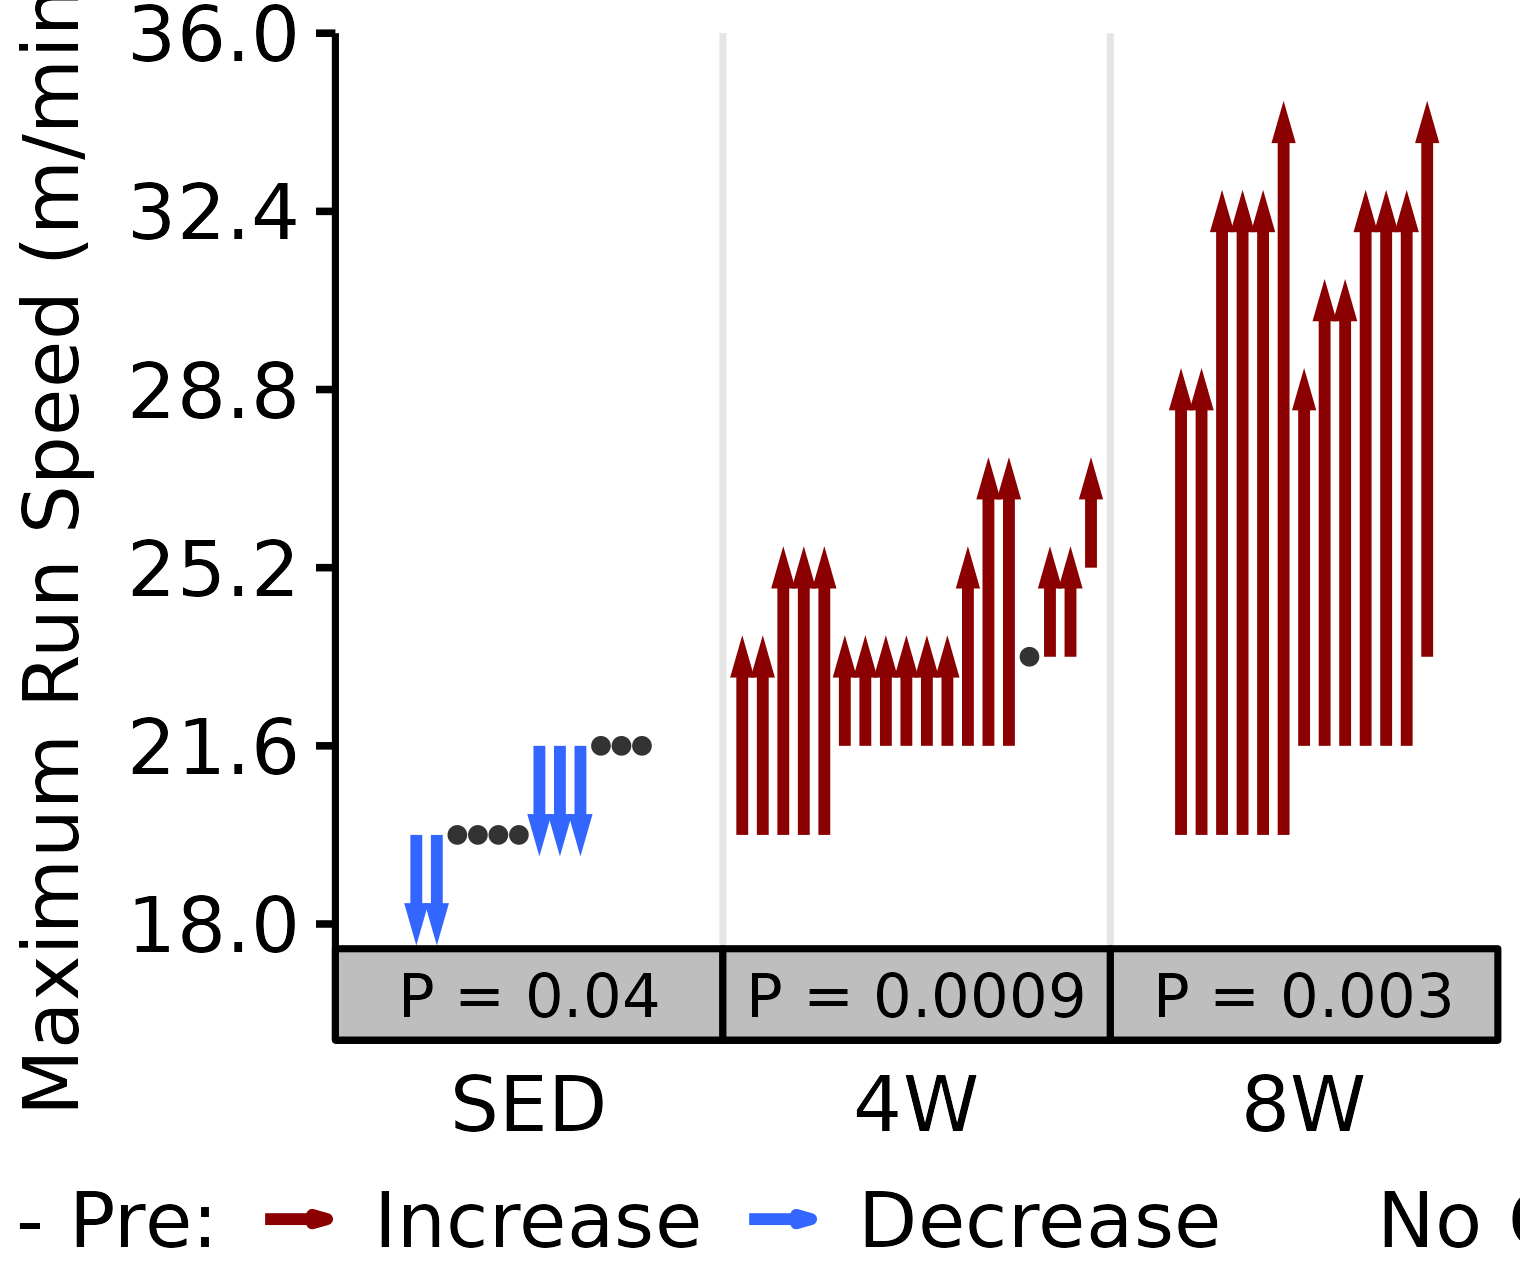
18M Female
# 18M Female max run speed
plot_pre_post(x = filter(VO2MAX, age == "18M", sex == "Female"),
              pre = "pre_speed_max", post = "post_speed_max",
              stats = filter(PRE_POST_STATS, response == "Maximum Run Speed",
                             age == "18M", sex == "Female"),
              ymin = 15.7, ymax = 30.6) +
  scale_y_continuous(name = "Maximum Run Speed (m/min)",
                     breaks = seq(16.2, 30.6, 3.6),
                     expand = expansion(mult = c(0, 5e-3)))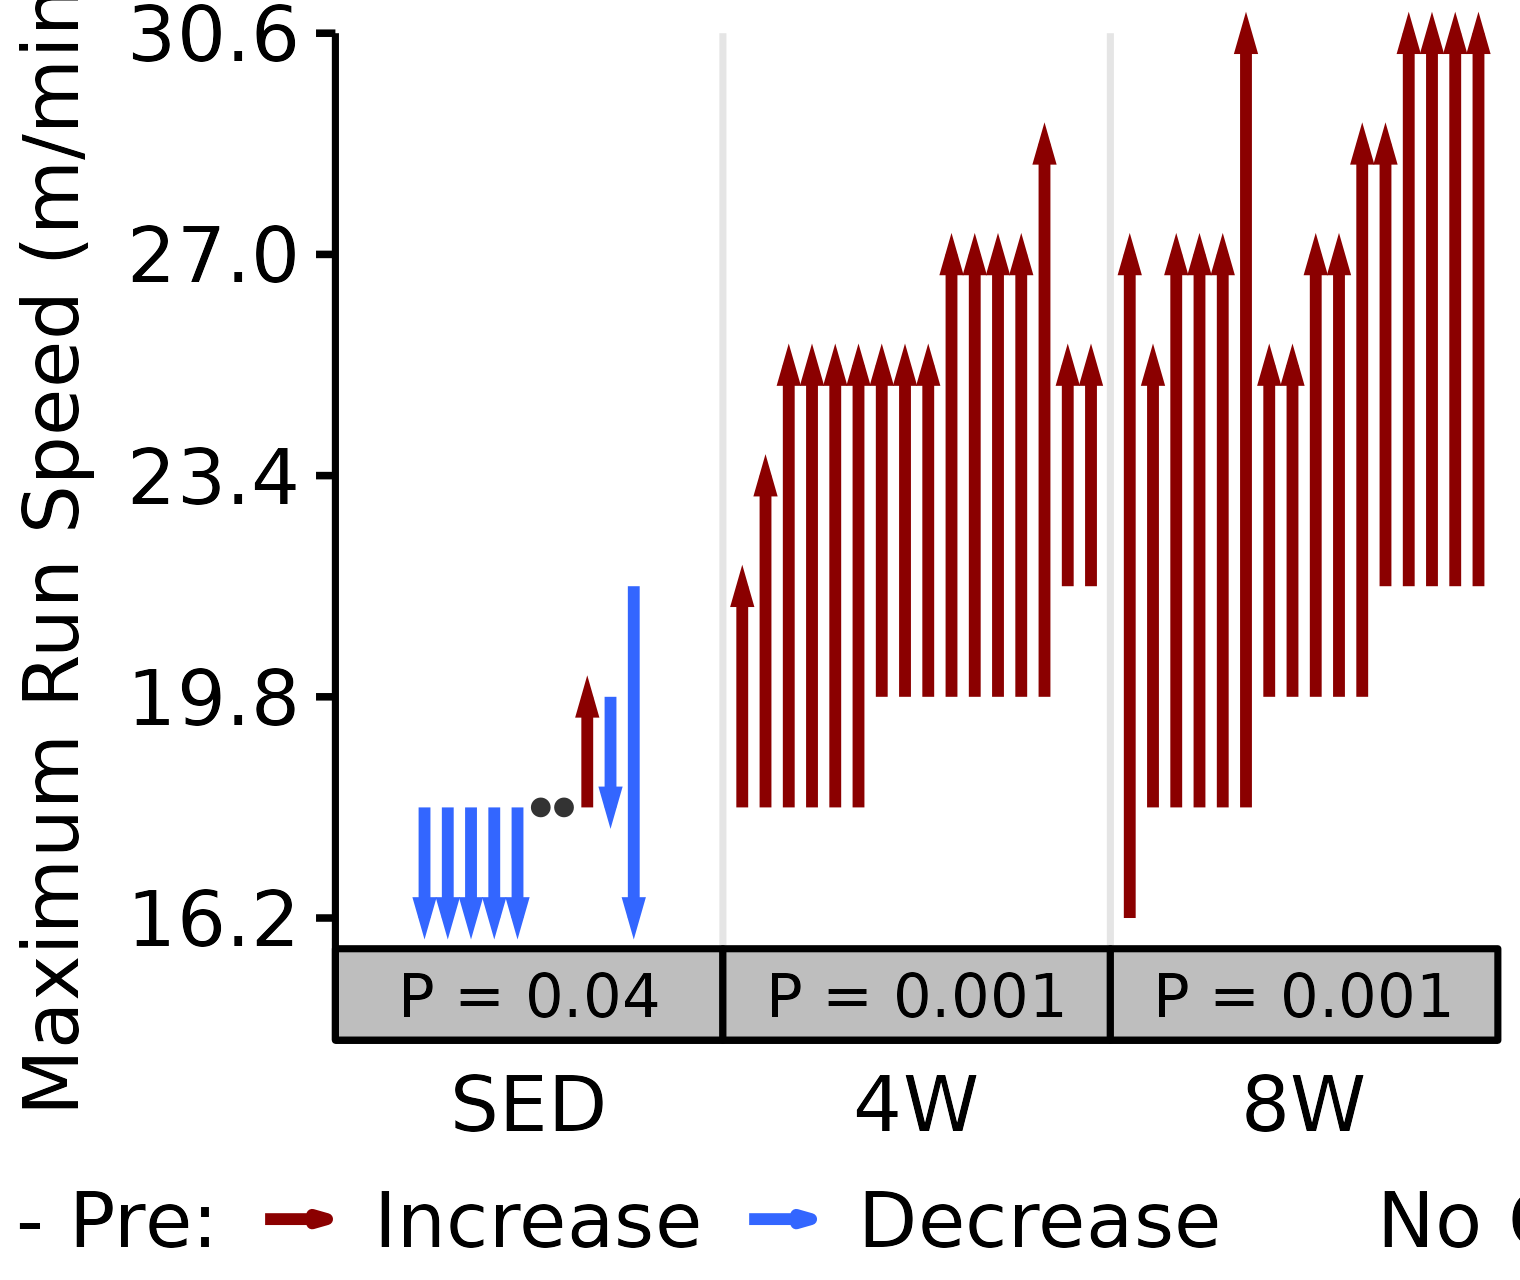
18M Male
# 18M Female max run speed
plot_pre_post(x = filter(VO2MAX, age == "18M", sex == "Male"),
              pre = "pre_speed_max", post = "post_speed_max",
              stats = filter(PRE_POST_STATS, response == "Maximum Run Speed",
                             age == "18M", sex == "Male"),
              ymin = 12.1, ymax = 27) +
  scale_y_continuous(name = "Maximum Run Speed (m/min)",
                     breaks = seq(12.6, 27, 3.6))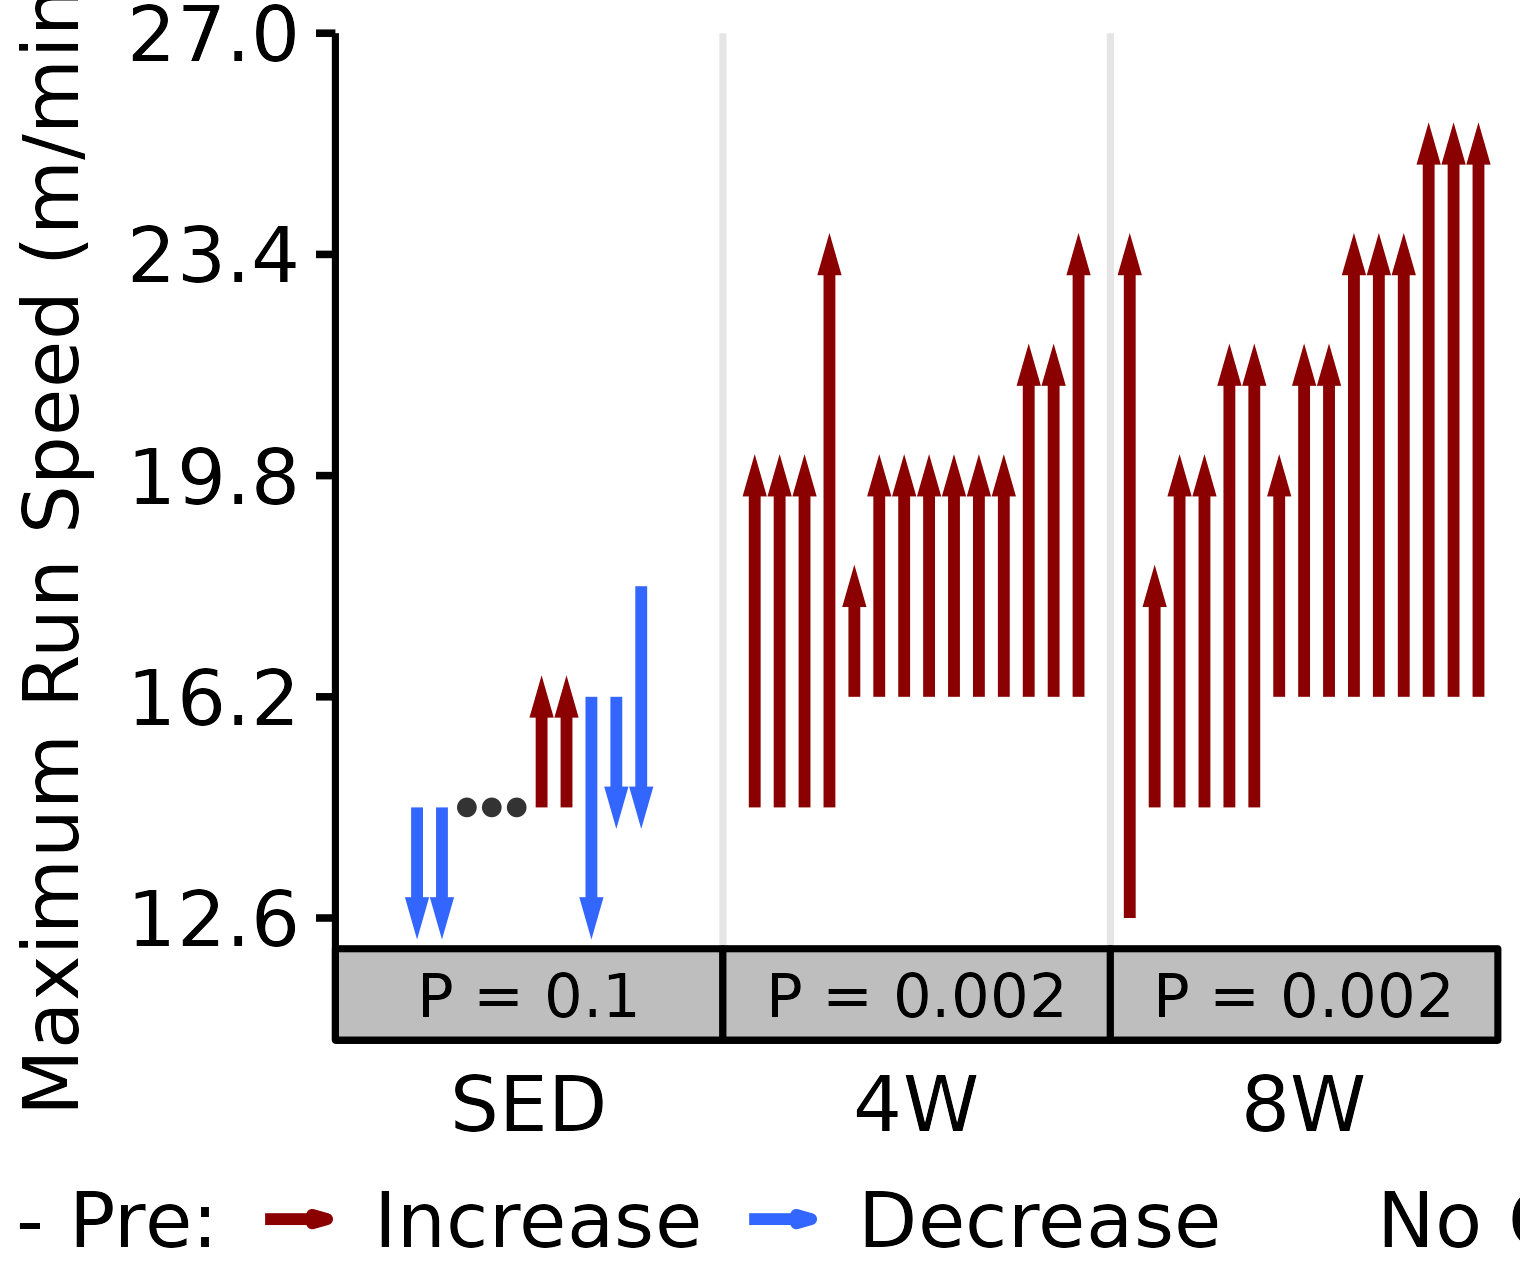
Post - Pre Differences
Body Mass
Body mass (g) recorded on the same day as the NMR body composition measures.
stats <- PRE_POST_STATS %>%
  filter(response == "NMR Body Mass") %>%
  # select(age, sex, group, estimate, signif) %>%
  mutate(age = factor(age, levels = c("6M", "18M"),
                      labels = c("Adult", "Aged")),
         color = sign(estimate) * signif,
         color = factor(color, levels = c(+1, -1, 0),
                        labels = c("Increase", "Decrease", "No Change")))

df <- NMR %>%
  arrange(age, sex, group) %>%
  mutate(val_diff = post_body_mass - pre_body_mass) %>%
  left_join(stats, by = c("age", "sex", "group")) %>%
  filter(!is.na(val_diff)) %>%
  mutate(age = factor(age, levels = c("6M", "18M"),
                      labels = c("Adult", "Aged")))

ggplot() +
  geom_hline(yintercept = 0, color = "grey", lwd = 0.3, lty = "dashed") +
  geom_point(aes(x = group, y = val_diff),
             data = df,
             position = position_beeswarm(dodge.width = 0.7, cex = 3,
                                          method = "compactswarm",
                                          side = 0L, corral = "gutter",
                                          corral.width = 0.8),
             na.rm = TRUE, shape = 16, size = 0.7) +
  # Lines for group means
  geom_crossbar(aes(x = group,
                    y = estimate,
                    ymin = estimate,
                    ymax = estimate,
                    color = color),
                data = stats, fatten = 1, width = 0.7, lwd = 0.8) +
  facet_nested_wrap(~ age + sex, nrow = 1, scales = "free_x") +
  labs(x = NULL,
       y = TeX("$\\Delta$ Body Mass (g)")) +
  coord_cartesian(ylim = c(-80, 80), clip = "off") +
  # scale_x_discrete(expand = expansion(add = 1)) +
  scale_y_continuous(breaks = seq(-80, 80, 20),
                     expand = expansion(mult = c(0, 5e-3))) +
  scale_color_manual(values = c("darkred", "#3366ff", "black"),
                     breaks = c("Increase", "Decrease", "No Change")) +
  theme_bw(base_size = 7) +
  theme(axis.text.x = element_text(size = 7, color = "black"),
        axis.text.y = element_text(size = 7, color = "black"),
        axis.title.y = element_text(size = 7, color = "black",
                                    margin = margin(r = 3, unit = "pt")),
        axis.ticks.y = element_line(color = "black"),
        panel.grid = element_blank(),
        axis.ticks.x = element_blank(),
        panel.border = element_rect(fill = NA, color = "black"),
        legend.position = "bottom",
        legend.direction = "horizontal",
        legend.title = element_text(size = 7, color = "black"),
        legend.text = element_text(size = 7, color = "black"),
        legend.margin = margin(t = 0.4, r = 4, b = 0.4, l = -3, unit = "pt"),
        legend.background = element_rect(color = "black"),
        legend.key.size = unit(1, "pt"),
        strip.text = element_text(size = 7, color = "white", face = "bold",
                                  margin = unit(c(2, 1, 2, 1), "pt")),
        strip.background = element_rect(fill = "#bfbfbf", color = "black"),
        panel.spacing = unit(-1, "pt"))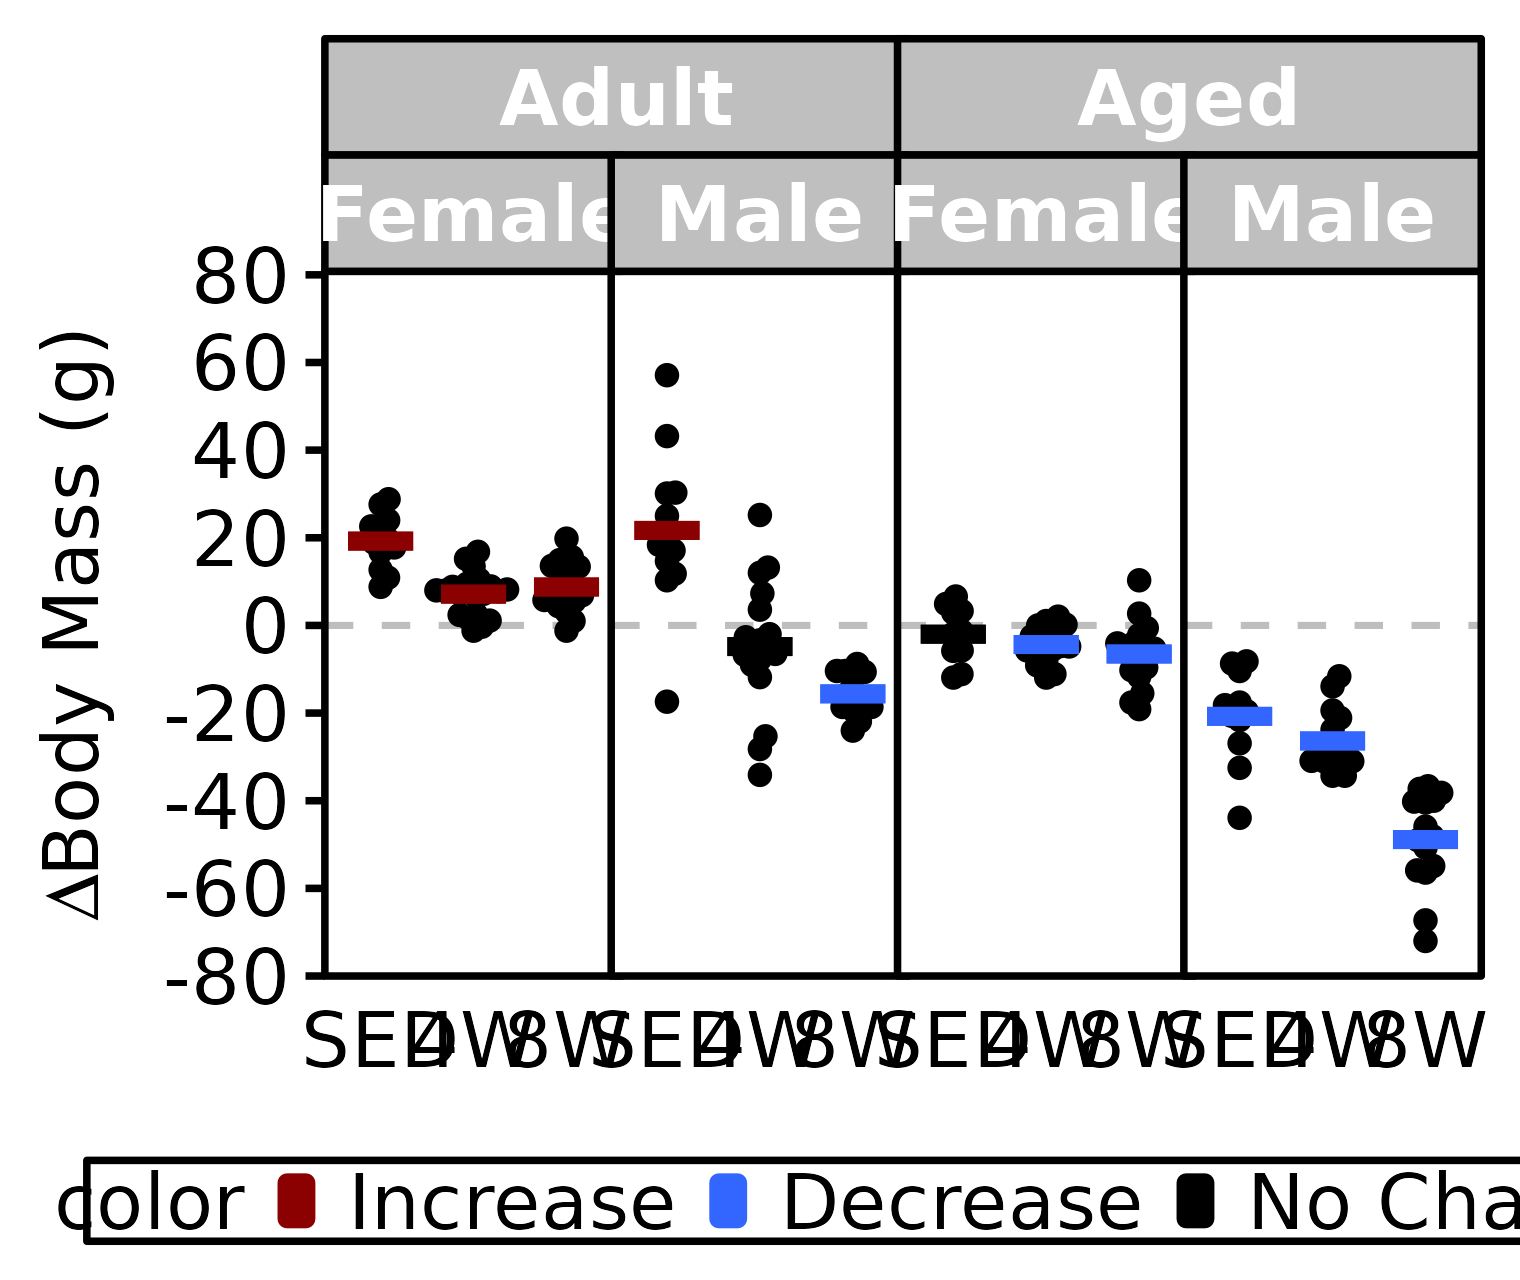
NMR Lean Mass
Lean mass (g) recorded via NMR.
stats <- PRE_POST_STATS %>%
  filter(response == "NMR Lean Mass") %>%
  mutate(age = factor(age, levels = c("6M", "18M"),
                      labels = c("Adult", "Aged")),
         color = sign(estimate) * signif,
         color = factor(color, levels = c(+1, -1, 0),
                        labels = c("Increase", "Decrease", "No Change")))

df <- NMR %>%
  arrange(age, sex, group) %>%
  mutate(diff = post_lean - pre_lean) %>%
  left_join(stats, by = c("age", "sex", "group")) %>%
  filter(!is.na(diff)) %>%
  mutate(age = factor(age, levels = c("6M", "18M"),
                      labels = c("Adult", "Aged")))

ggplot() +
  geom_hline(yintercept = 0, color = "grey", lwd = 0.3, lty = "dashed") +
  geom_point(aes(x = group, y = diff),
             data = df,
             position = position_beeswarm(dodge.width = 0.7, cex = 3,
                                          method = "compactswarm",
                                          side = 0L, corral = "gutter",
                                          corral.width = 0.8),
             na.rm = TRUE, shape = 16, size = 0.7) +
  # Lines for group means
  geom_crossbar(aes(x = group,
                    y = estimate,
                    ymin = estimate,
                    ymax = estimate,
                    color = color),
                data = stats, fatten = 1, width = 0.7, lwd = 0.8) +
  facet_nested_wrap(~ age + sex, nrow = 1, scales = "free_x") +
  labs(x = NULL,
       y = TeX("$\\Delta$ Lean Mass (g)")) +
  coord_cartesian(ylim = c(-30, 40), clip = "off") +
  scale_y_continuous(breaks = seq(-30, 40, 10),
                     expand = expansion(mult = c(0, 5e-3))) +
  scale_color_manual(values = c("darkred", "#3366ff", "black"),
                     breaks = c("Increase", "Decrease", "No Change")) +
  theme_bw(base_size = 7) +
  theme(axis.text.x = element_text(size = 7, color = "black"),
        axis.text.y = element_text(size = 7, color = "black"),
        axis.title.y = element_text(size = 7, color = "black",
                                    margin = margin(r = 3, unit = "pt")),
        axis.ticks.y = element_line(color = "black"),
        panel.grid = element_blank(),
        axis.ticks.x = element_blank(),
        panel.border = element_rect(fill = NA, color = "black"),
        legend.position = "bottom",
        legend.direction = "horizontal",
        legend.title = element_text(size = 7, color = "black"),
        legend.text = element_text(size = 7, color = "black"),
        legend.margin = margin(t = 0.4, r = 4, b = 0.4, l = -3, unit = "pt"),
        legend.background = element_rect(color = "black"),
        legend.key.size = unit(1, "pt"),
        strip.text = element_text(size = 7, color = "white", face = "bold",
                                  margin = unit(c(2, 1, 2, 1), "pt")),
        strip.background = element_rect(fill = "#bfbfbf", color = "black"),
        panel.spacing = unit(-1, "pt"))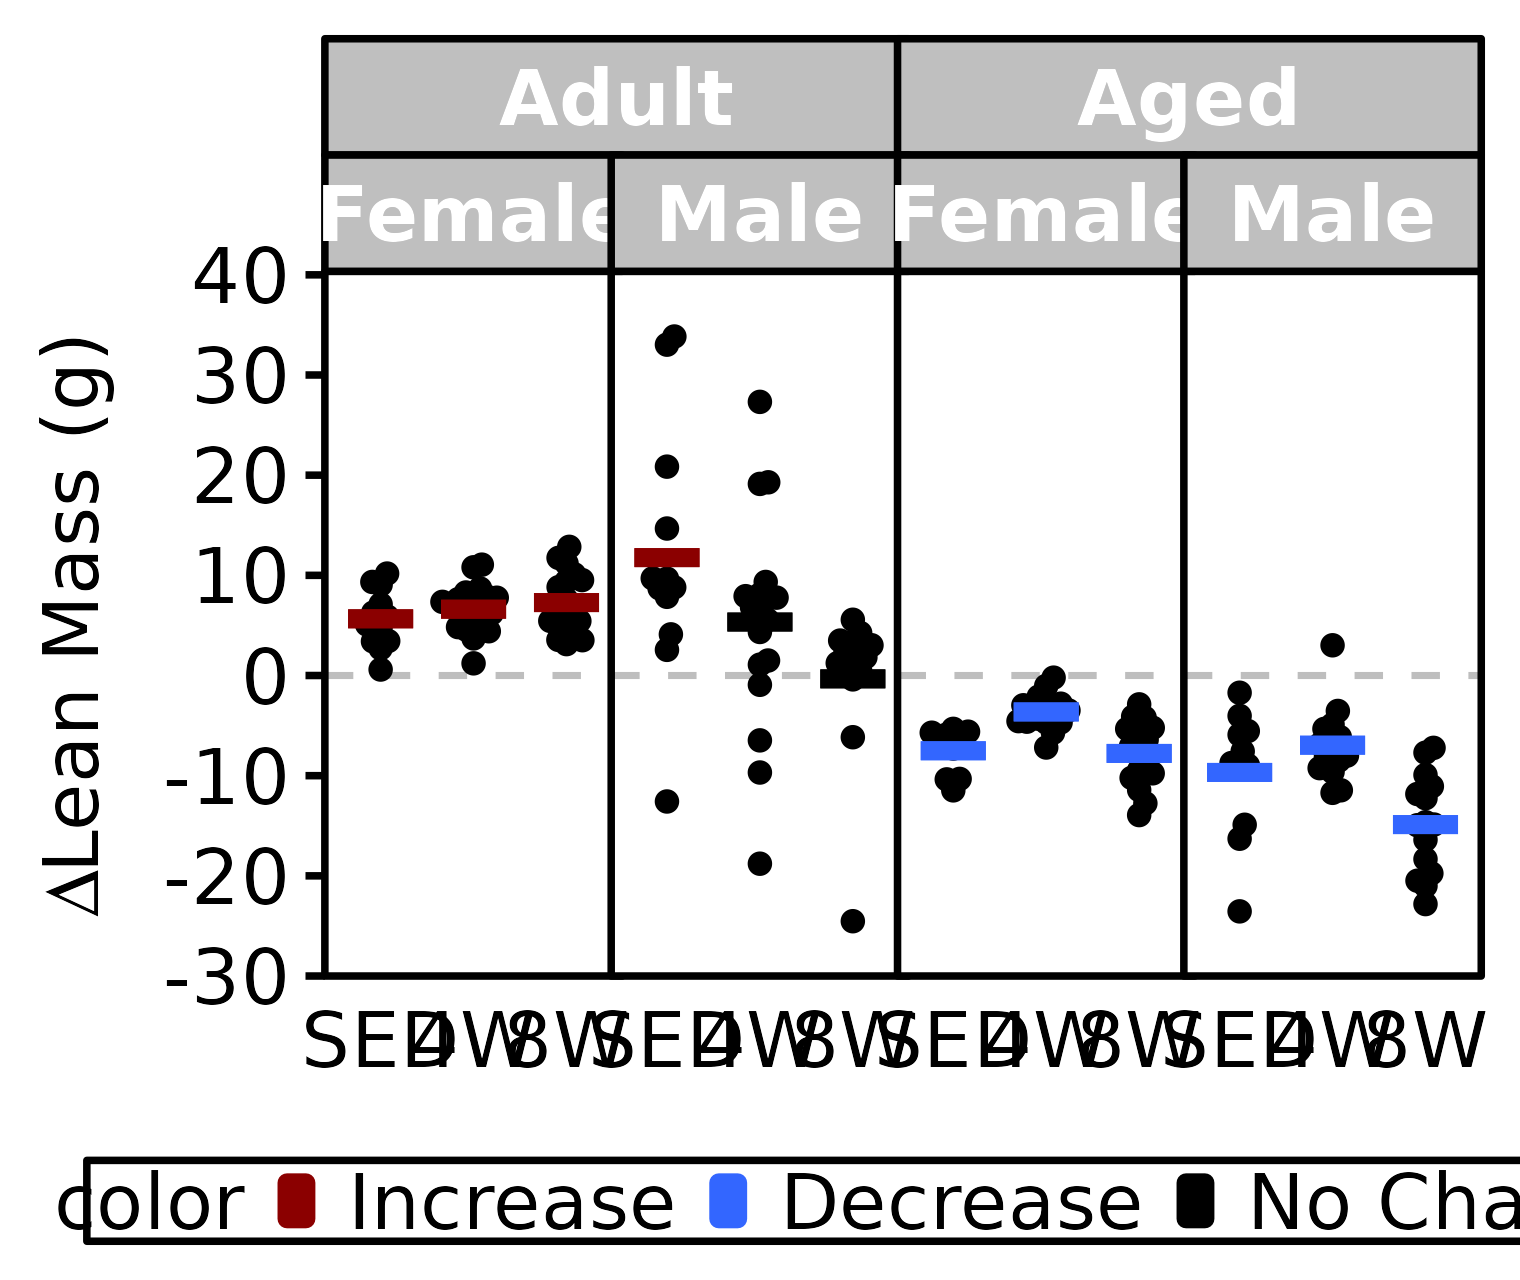
NMR Fat Mass
Fat mass (g) recorded via NMR.
stats <- PRE_POST_STATS %>%
  filter(response == "NMR Fat Mass") %>%
  mutate(age = factor(age, levels = c("6M", "18M"),
                      labels = c("Adult", "Aged")),
         color = sign(estimate) * signif,
         color = factor(color, levels = c(+1, -1, 0),
                        labels = c("Increase", "Decrease", "No Change")))

df <- NMR %>%
  arrange(age, sex, group) %>%
  mutate(diff = post_fat - pre_fat) %>%
  left_join(stats, by = c("age", "sex", "group")) %>%
  filter(!is.na(diff)) %>%
  mutate(age = factor(age, levels = c("6M", "18M"),
                      labels = c("Adult", "Aged")))

ggplot() +
  geom_hline(yintercept = 0, color = "grey", lwd = 0.3, lty = "dashed") +
  geom_point(aes(x = group, y = diff),
             data = df,
             position = position_beeswarm(dodge.width = 0.7, cex = 3,
                                          method = "compactswarm",
                                          side = 0L, corral = "gutter",
                                          corral.width = 0.8),
             na.rm = TRUE, shape = 16, size = 0.7) +
  # Lines for group means
  geom_crossbar(aes(x = group,
                    y = estimate,
                    ymin = estimate,
                    ymax = estimate,
                    color = color),
                data = stats, fatten = 1, width = 0.7, lwd = 0.8) +
  facet_nested_wrap(~ age + sex, nrow = 1, scales = "free_x") +
  labs(x = NULL,
       y = TeX("$\\Delta$ Fat Mass (g)")) +
  coord_cartesian(ylim = c(-50, 30), clip = "off") +
  scale_y_continuous(breaks = seq(-50, 30, 10),
                     expand = expansion(mult = c(0, 5e-3))) +
  scale_color_manual(values = c("darkred", "#3366ff", "black"),
                     breaks = c("Increase", "Decrease", "No Change")) +
  theme_bw(base_size = 7) +
  theme(axis.text.x = element_text(size = 7, color = "black"),
        axis.text.y = element_text(size = 7, color = "black"),
        axis.title.y = element_text(size = 7, color = "black",
                                    margin = margin(r = 3, unit = "pt")),
        axis.ticks.y = element_line(color = "black"),
        panel.grid = element_blank(),
        axis.ticks.x = element_blank(),
        panel.border = element_rect(fill = NA, color = "black"),
        legend.position = "bottom",
        legend.direction = "horizontal",
        legend.title = element_text(size = 7, color = "black"),
        legend.text = element_text(size = 7, color = "black"),
        legend.margin = margin(t = 0.4, r = 4, b = 0.4, l = -3, unit = "pt"),
        legend.background = element_rect(color = "black"),
        legend.key.size = unit(1, "pt"),
        strip.text = element_text(size = 7, color = "white", face = "bold",
                                  margin = unit(c(2, 1, 2, 1), "pt")),
        strip.background = element_rect(fill = "#bfbfbf", color = "black"),
        panel.spacing = unit(-1, "pt"))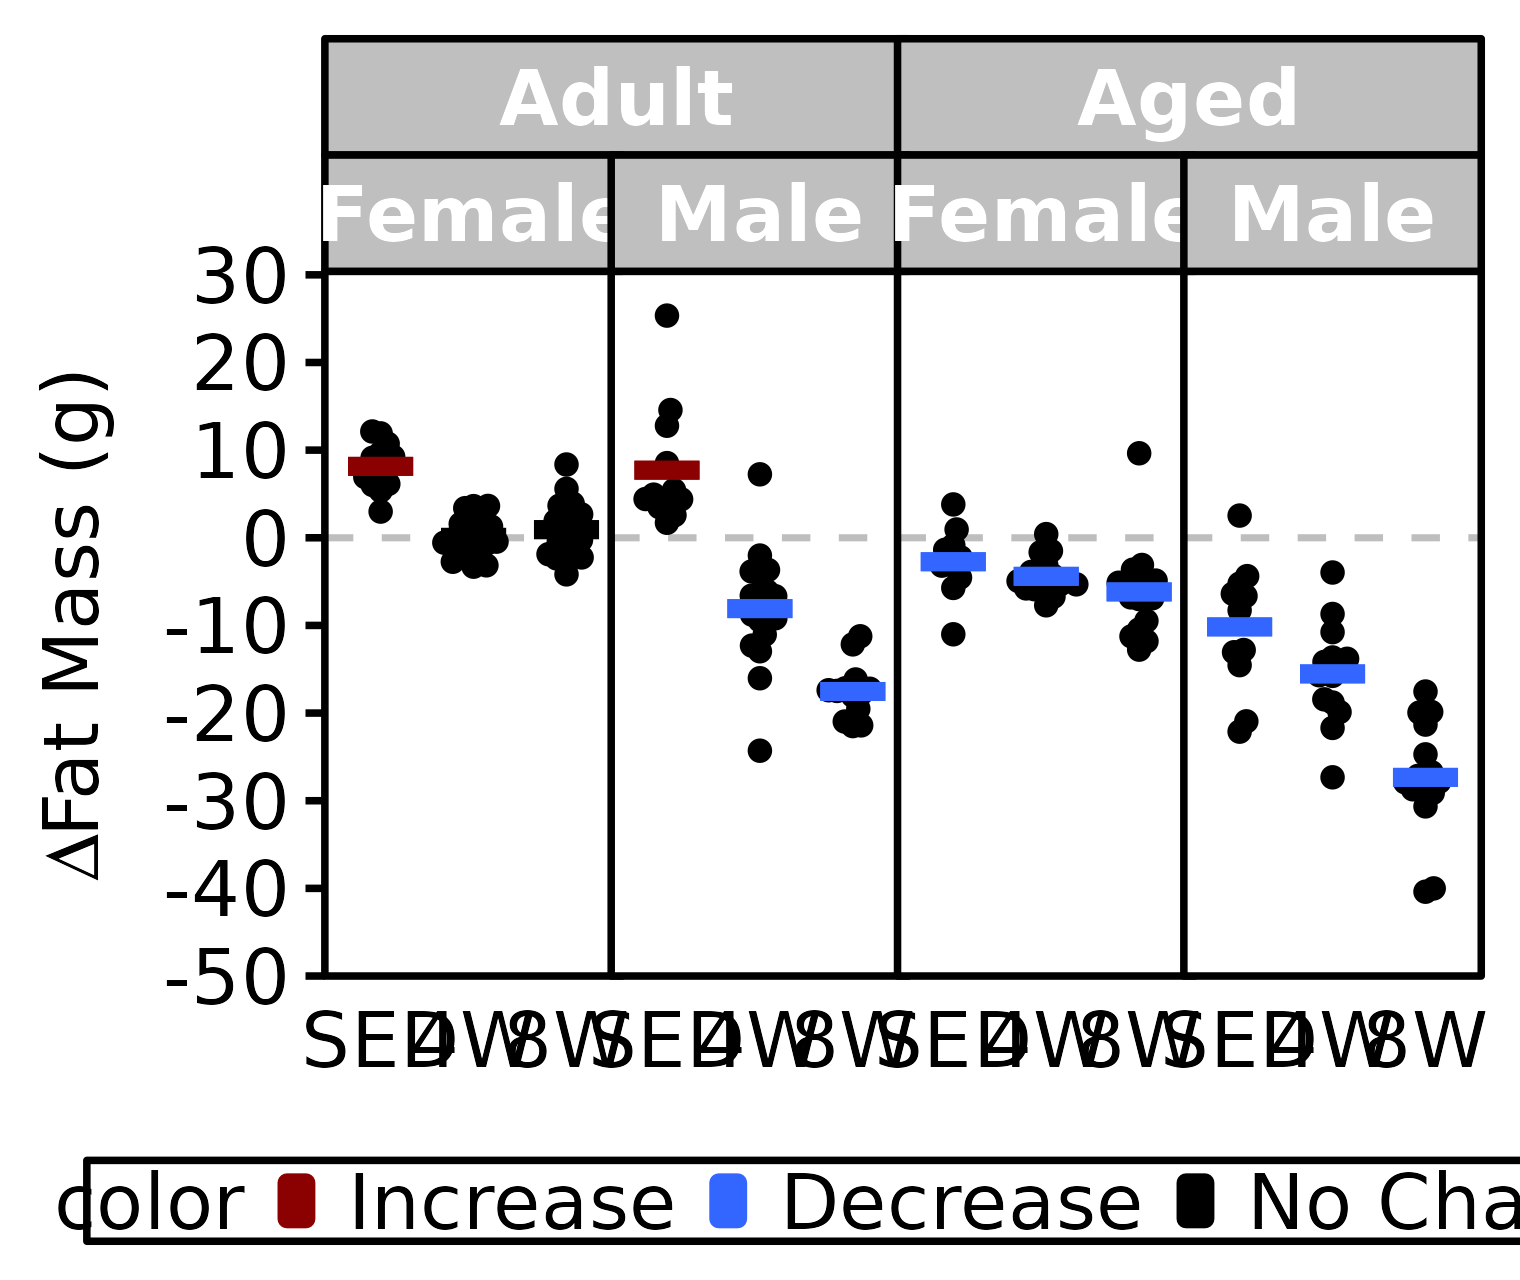
Relative VO2max
stats <- PRE_POST_STATS %>%
  filter(response == "Relative VO2max") %>%
  mutate(age = factor(age, levels = c("6M", "18M"),
                      labels = c("Adult", "Aged")),
         color = sign(estimate) * signif,
         color = factor(color, levels = c(+1, -1, 0),
                        labels = c("Increase", "Decrease", "No Change")))

df <- VO2MAX %>%
  arrange(age, sex, group) %>%
  mutate(diff = post_vo2max_ml_kg_min - pre_vo2max_ml_kg_min) %>%
  left_join(stats, by = c("age", "sex", "group")) %>%
  filter(!is.na(diff)) %>%
  mutate(age = factor(age, levels = c("6M", "18M"),
                      labels = c("Adult", "Aged")))

ggplot() +
  geom_hline(yintercept = 0, color = "grey", lwd = 0.3, lty = "dashed") +
  geom_point(aes(x = group, y = diff),
             data = df,
             position = position_beeswarm(dodge.width = 0.7, cex = 3,
                                          method = "compactswarm",
                                          side = 0L, corral = "gutter",
                                          corral.width = 0.8),
             na.rm = TRUE, shape = 16, size = 0.7) +
  # Lines for group means
  geom_crossbar(aes(x = group,
                    y = estimate,
                    ymin = estimate,
                    ymax = estimate,
                    color = color),
                data = stats, fatten = 1, width = 0.7, lwd = 0.8) +
  facet_nested(~ age + sex, scales = "free_x", space = "free_x") +
  labs(x = NULL,
       y = TeX("$\\Delta$ VO$_2$max (mL/kg/min)")) +
  coord_cartesian(ylim = c(-20, 20), clip = "off") +
  scale_y_continuous(breaks = seq(-20, 20, 5),
                     expand = expansion(mult = c(0, 5e-3))) +
  scale_color_manual(values = c("darkred", "#3366ff", "black"),
                     breaks = c("Increase", "Decrease", "No Change")) +
  theme_bw(base_size = 7) +
  theme(axis.text.x = element_text(size = 7, color = "black"),
        axis.text.y = element_text(size = 7, color = "black"),
        axis.title.y = element_text(size = 7, color = "black",
                                    margin = margin(r = 3, unit = "pt")),
        axis.ticks.y = element_line(color = "black"),
        panel.grid = element_blank(),
        axis.ticks.x = element_blank(),
        panel.border = element_rect(fill = NA, color = "black"),
        legend.position = "bottom",
        legend.direction = "horizontal",
        legend.title = element_text(size = 7, color = "black"),
        legend.text = element_text(size = 7, color = "black"),
        legend.margin = margin(t = 0.4, r = 4, b = 0.4, l = -3, unit = "pt"),
        legend.background = element_rect(color = "black"),
        legend.key.size = unit(1, "pt"),
        strip.text = element_text(size = 7, color = "white", face = "bold",
                                  margin = unit(c(2, 1, 2, 1), "pt")),
        strip.background = element_rect(fill = "#bfbfbf", color = "black"),
        panel.spacing = unit(-1, "pt"))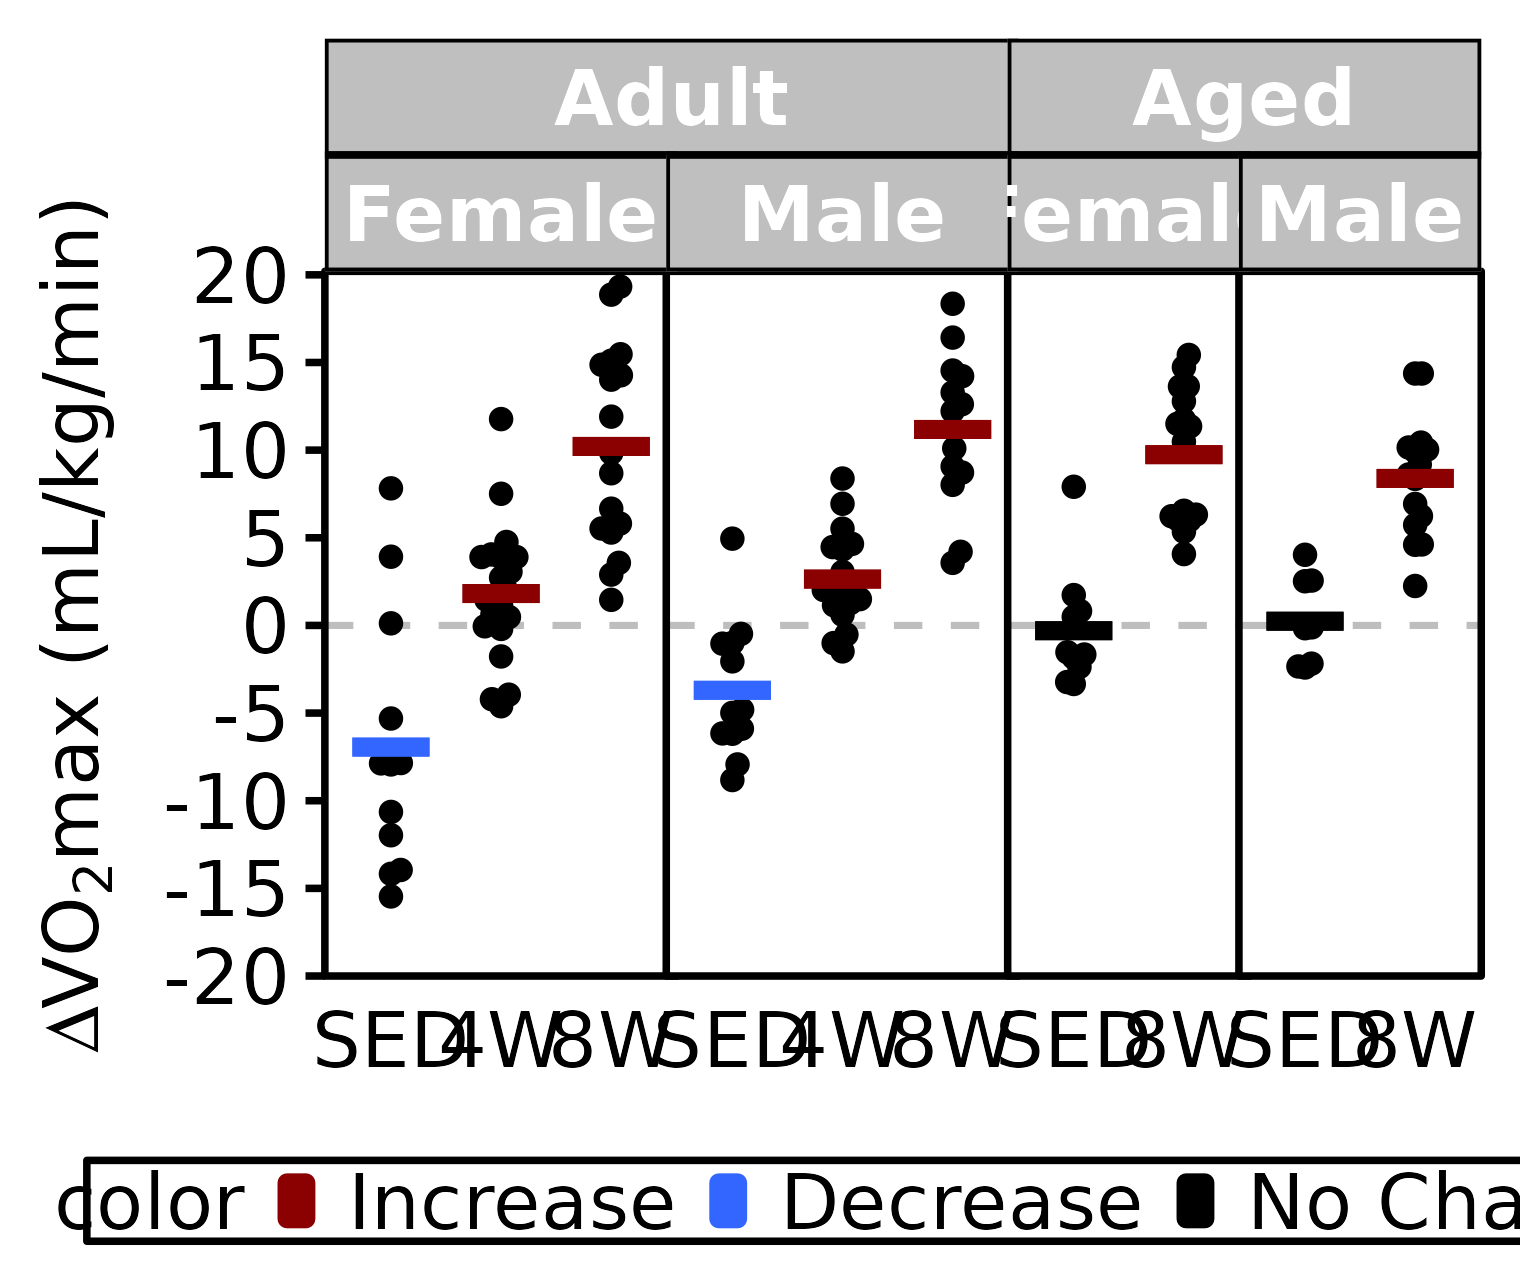
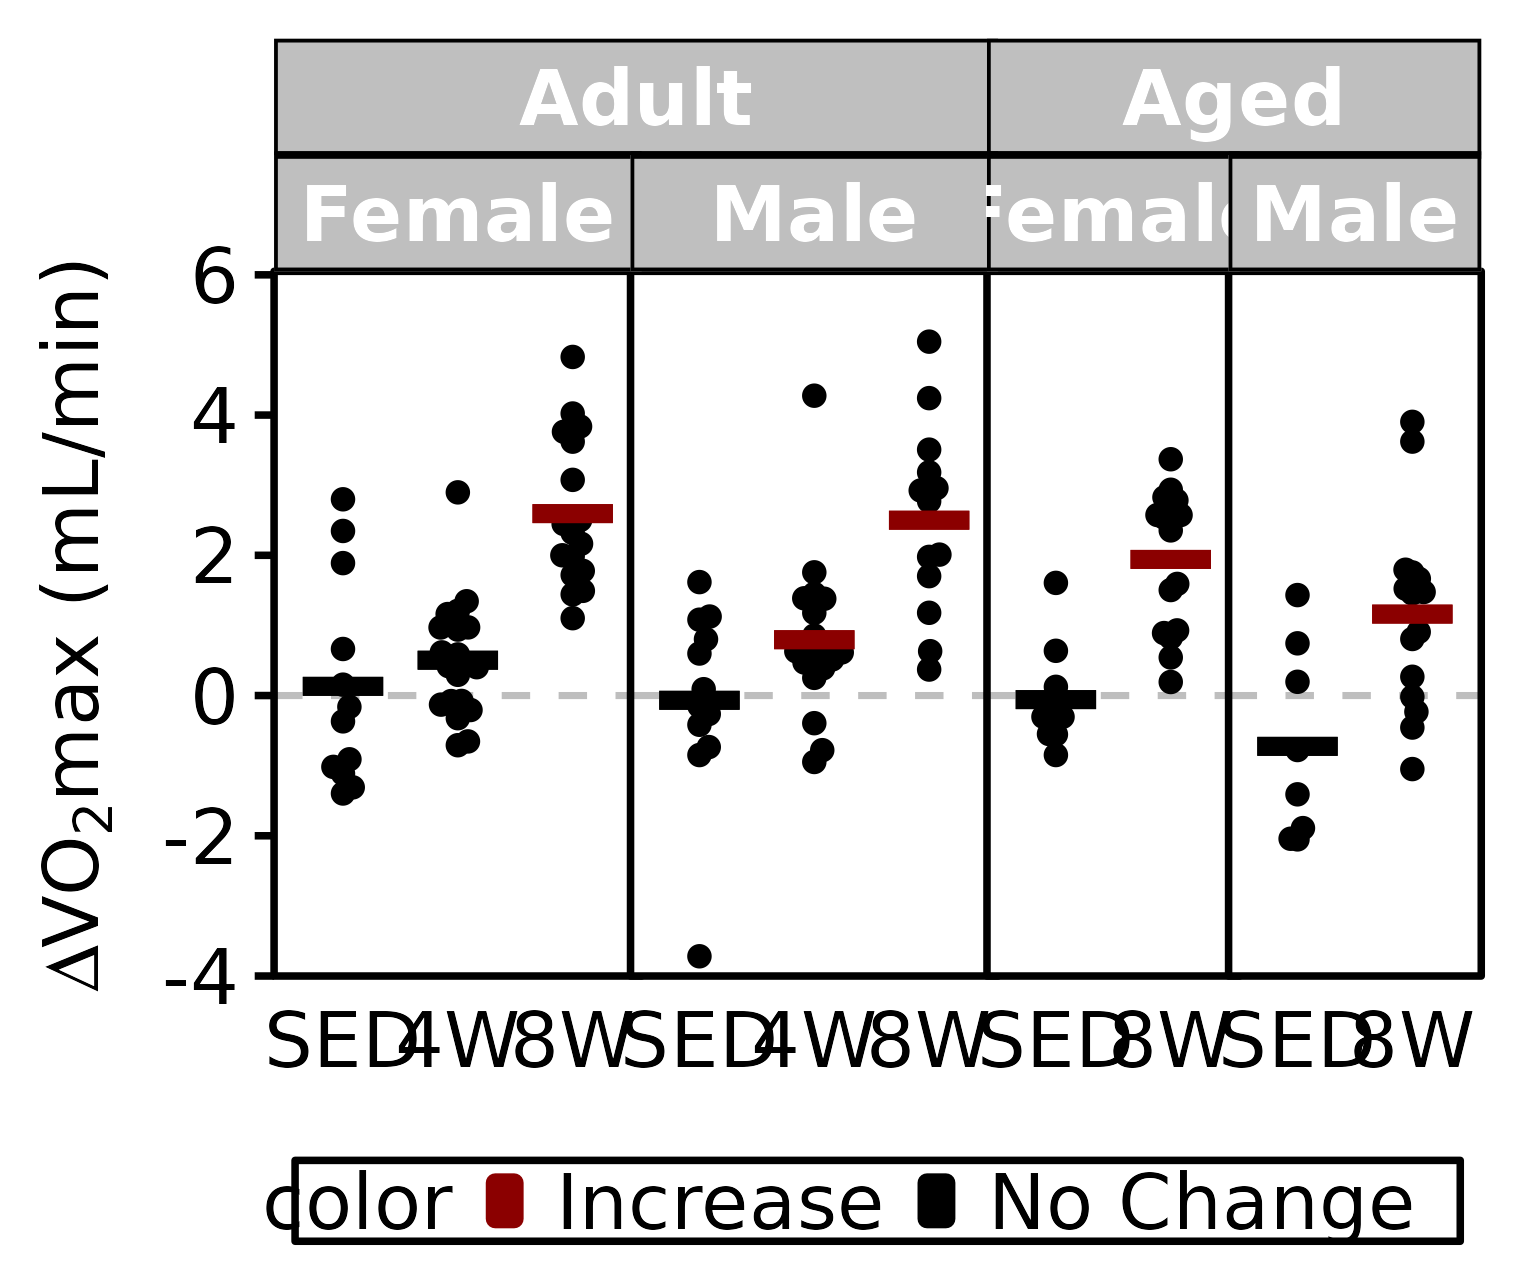
Relative VO2max
stats <- PRE_POST_STATS %>%
  filter(response == "Absolute VO2max") %>%
  mutate(age = factor(age, levels = c("6M", "18M"),
                      labels = c("Adult", "Aged")),
         color = sign(estimate) * signif,
         color = factor(color, levels = c(+1, -1, 0),
                        labels = c("Increase", "Decrease", "No Change")))

df <- VO2MAX %>%
  arrange(age, sex, group) %>%
  mutate(diff = post_vo2max_ml_min - pre_vo2max_ml_min) %>%
  left_join(stats, by = c("age", "sex", "group")) %>%
  filter(!is.na(diff)) %>%
  mutate(age = factor(age, levels = c("6M", "18M"),
                      labels = c("Adult", "Aged")))

ggplot() +
  geom_hline(yintercept = 0, color = "grey", lwd = 0.3, lty = "dashed") +
  geom_point(aes(x = group, y = diff),
             data = df,
             position = position_beeswarm(dodge.width = 0.7, cex = 3,
                                          method = "compactswarm",
                                          side = 0L, corral = "gutter",
                                          corral.width = 0.8),
             na.rm = TRUE, shape = 16, size = 0.7) +
  # Lines for group means
  geom_crossbar(aes(x = group,
                    y = estimate,
                    ymin = estimate,
                    ymax = estimate,
                    color = color),
                data = stats, fatten = 1, width = 0.7, lwd = 0.8) +
  facet_nested(~ age + sex, scales = "free_x", space = "free_x") +
  labs(x = NULL,
       y = TeX("$\\Delta$ VO$_2$max (mL/min)")) +
  coord_cartesian(ylim = c(-4, 6), clip = "off") +
  scale_y_continuous(breaks = seq(-4, 6, 2),
                     expand = expansion(mult = c(0, 5e-3))) +
  scale_color_manual(values = c("darkred", "#3366ff", "black"),
                     breaks = c("Increase", "Decrease", "No Change")) +
  theme_bw(base_size = 7) +
  theme(axis.text.x = element_text(size = 7, color = "black"),
        axis.text.y = element_text(size = 7, color = "black"),
        axis.title.y = element_text(size = 7, color = "black",
                                    margin = margin(r = 3, unit = "pt")),
        axis.ticks.y = element_line(color = "black"),
        panel.grid = element_blank(),
        axis.ticks.x = element_blank(),
        panel.border = element_rect(fill = NA, color = "black"),
        legend.position = "bottom",
        legend.direction = "horizontal",
        legend.title = element_text(size = 7, color = "black"),
        legend.text = element_text(size = 7, color = "black"),
        legend.margin = margin(t = 0.4, r = 4, b = 0.4, l = -3, unit = "pt"),
        legend.background = element_rect(color = "black"),
        legend.key.size = unit(1, "pt"),
        strip.text = element_text(size = 7, color = "white", face = "bold",
                                  margin = unit(c(2, 1, 2, 1), "pt")),
        strip.background = element_rect(fill = "#bfbfbf", color = "black"),
        panel.spacing = unit(-1, "pt"))