Plots of tissue dissection times
Tyler Sagendorf
01 May, 2024
Source:vignettes/articles/dissection_time_plots.Rmd
dissection_time_plots.Rmd
# Required packages
library(MotrpacRatTrainingPhysiologyData)
library(dplyr)
library(purrr)
library(tidyr)
library(ggplot2)
library(scales)
Overview
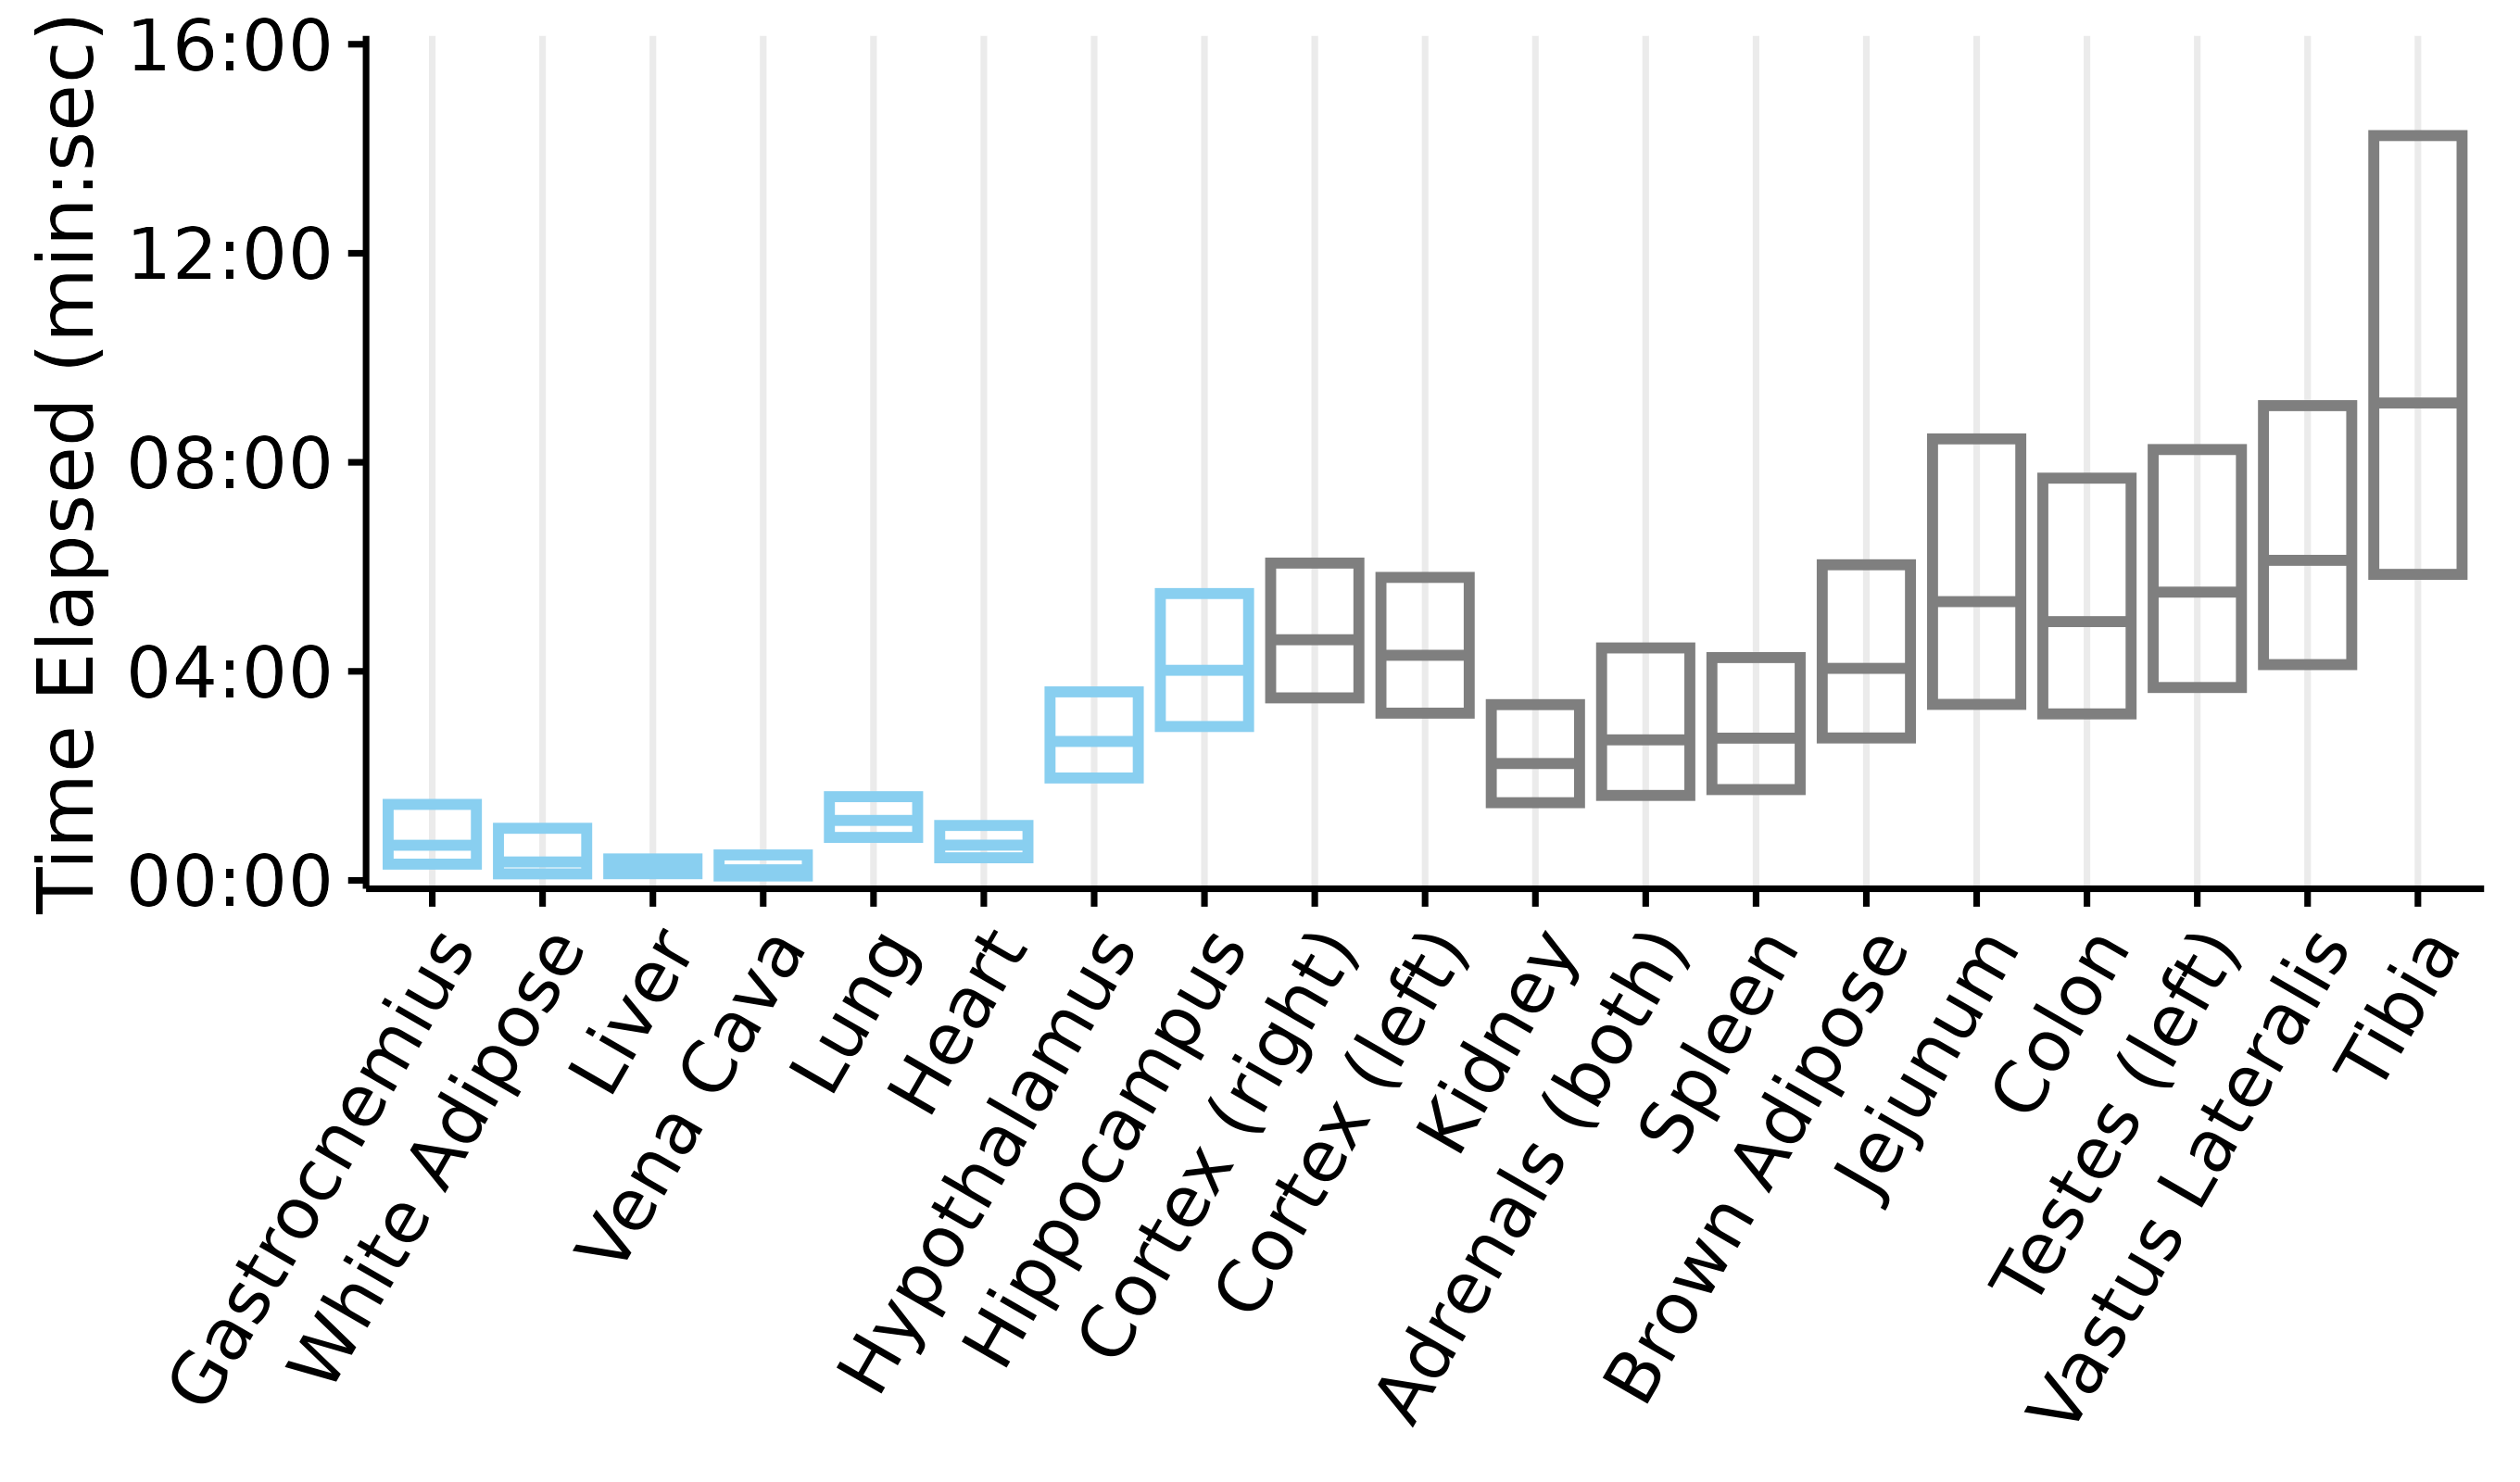
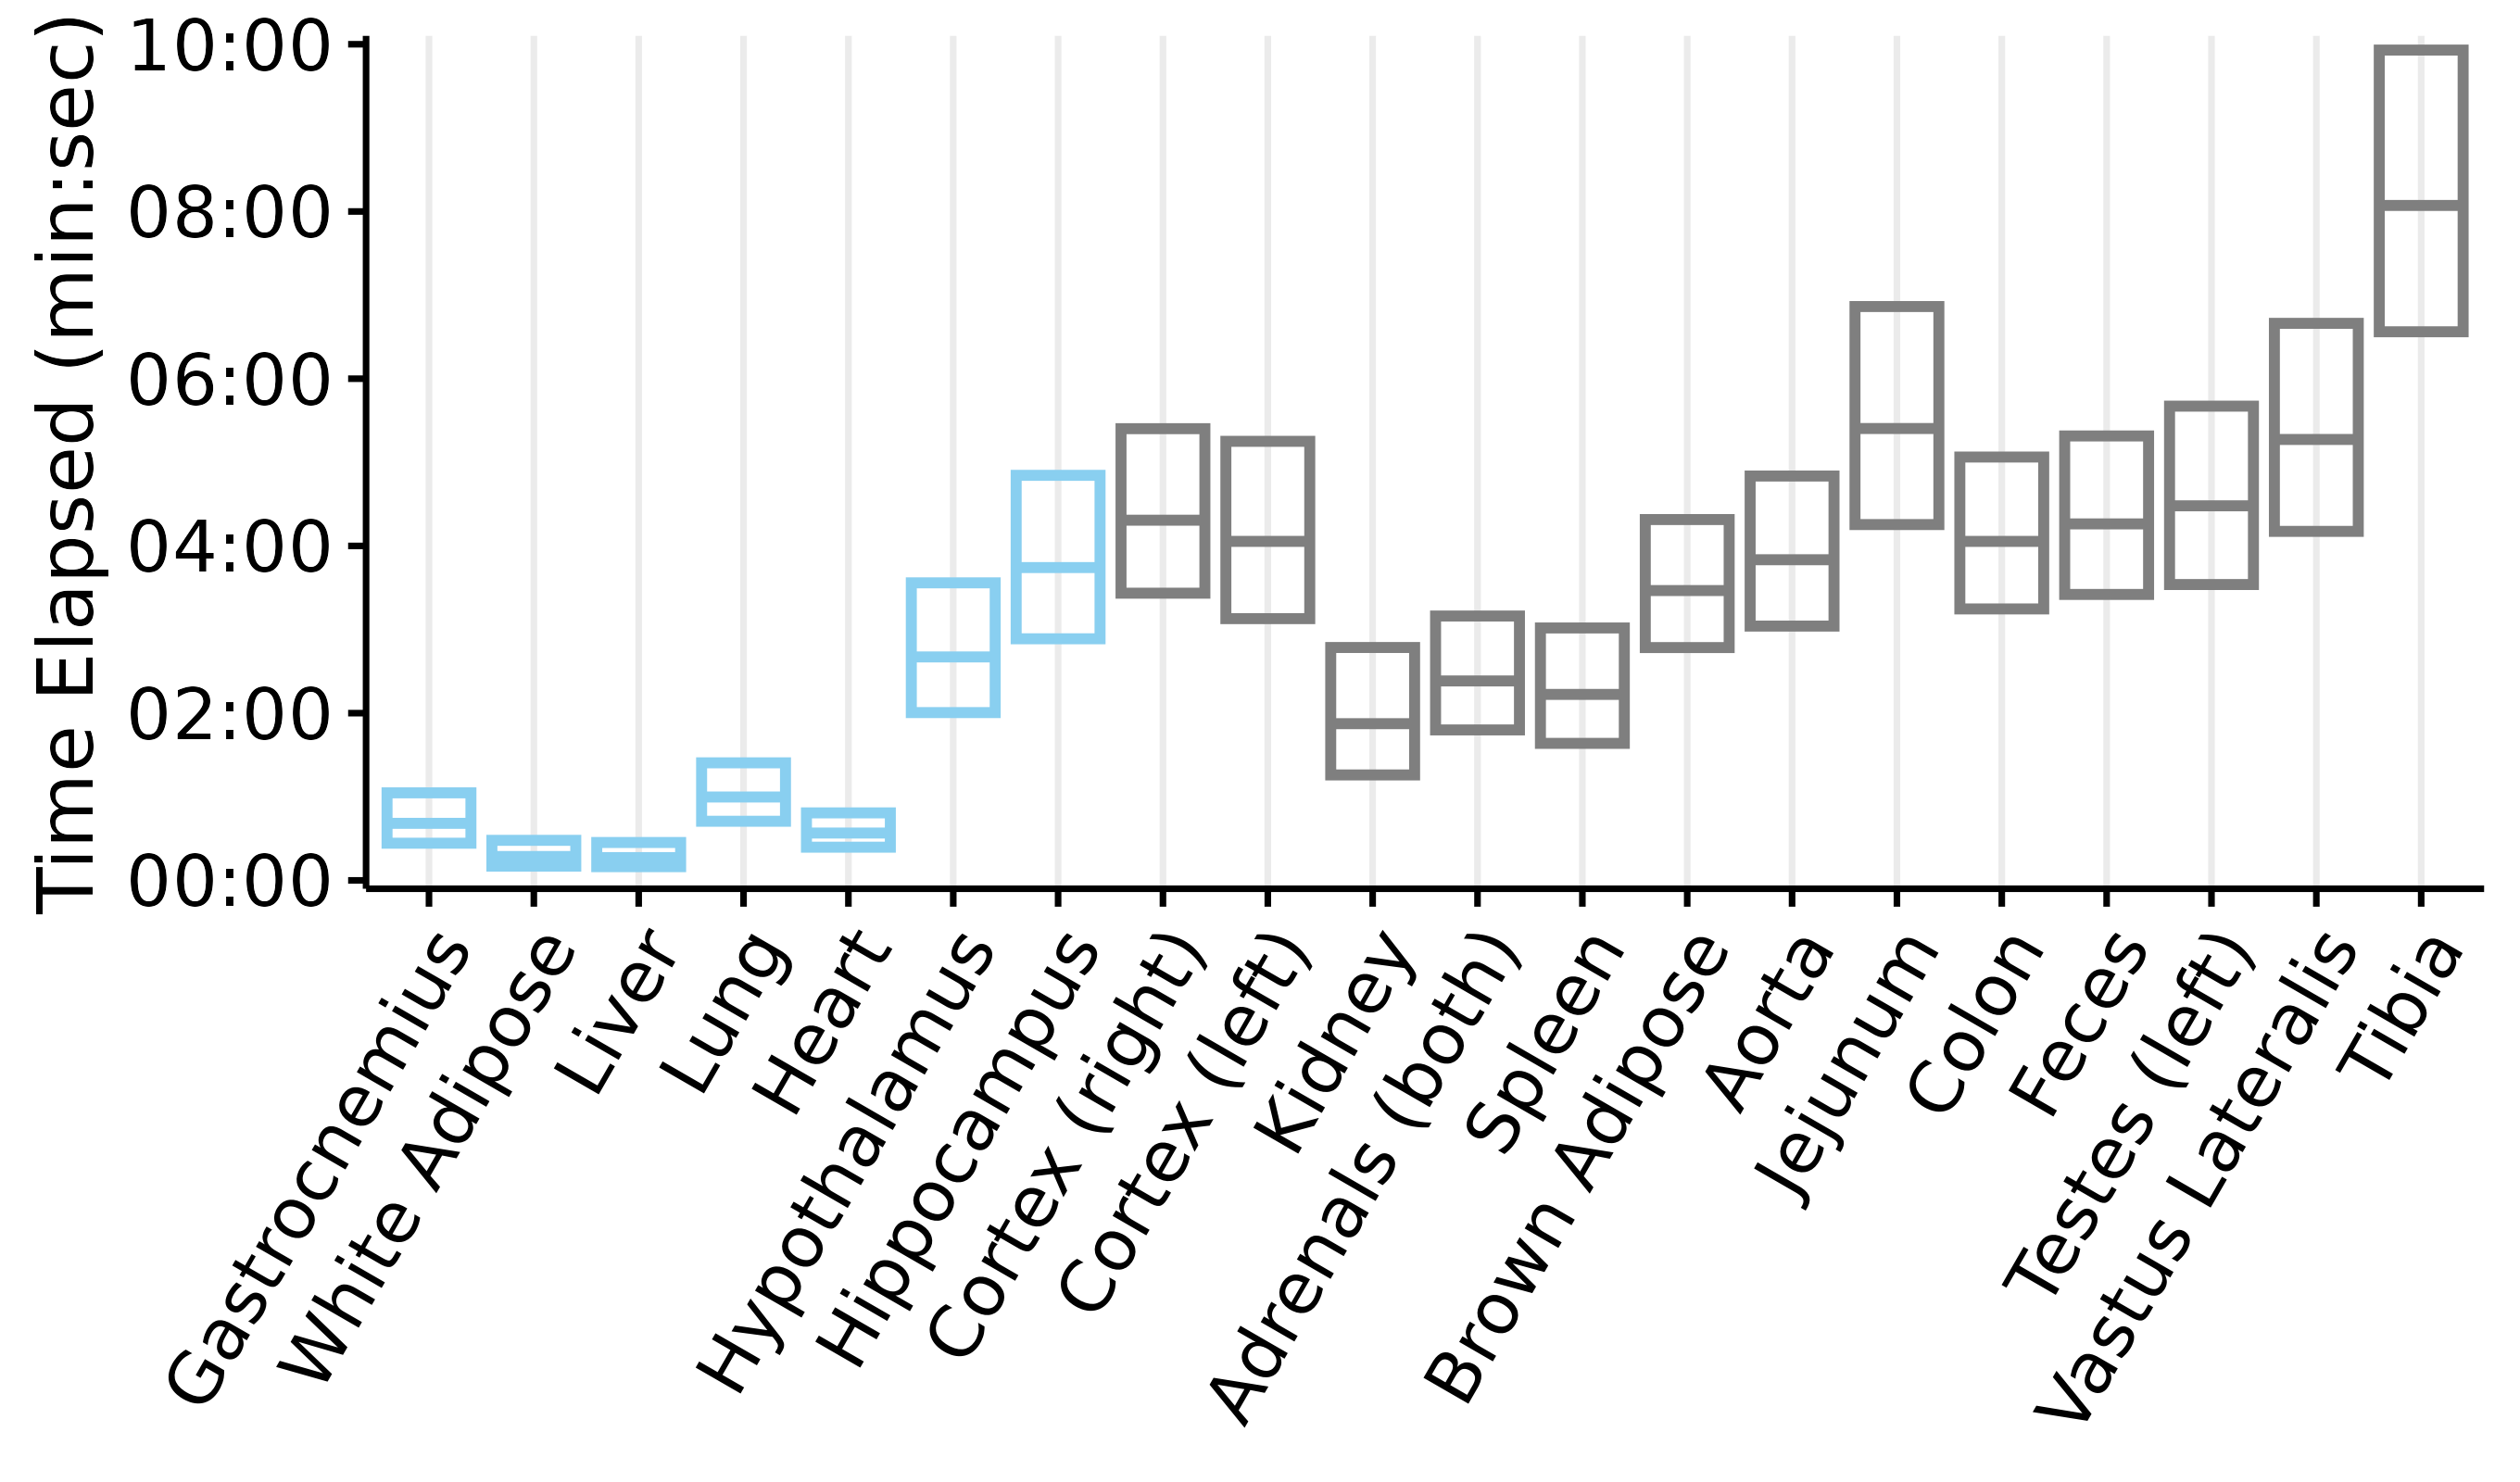
This article generates plots of the tissue dissection times: time elapsed from collection to freezing (if the tissue was collected under anesthesia) or death to freezing (if the tissue was collected post-mortem). Each box represents the mean \(\pm\) 2 standard deviations. Blue indicates that the tissue was collected while the rat was anesthetized, while grey indicates that the tissue was collected post-mortem.
# Create and save all 4 plots
foo <- DISSECTION_TIMES %>%
  nest(.by = c(age, sex)) %>%
  arrange(age, sex) %>%
  mutate(ymax = c(12, 16, 10, 10),
         plots = map2(.x = data, .y = ymax, .f = plot_dissection_times),
         file_name = file.path("..", "..", "plots",
                               sprintf("dissection_times_%s_%s.pdf",
                                       age, tolower(sex))))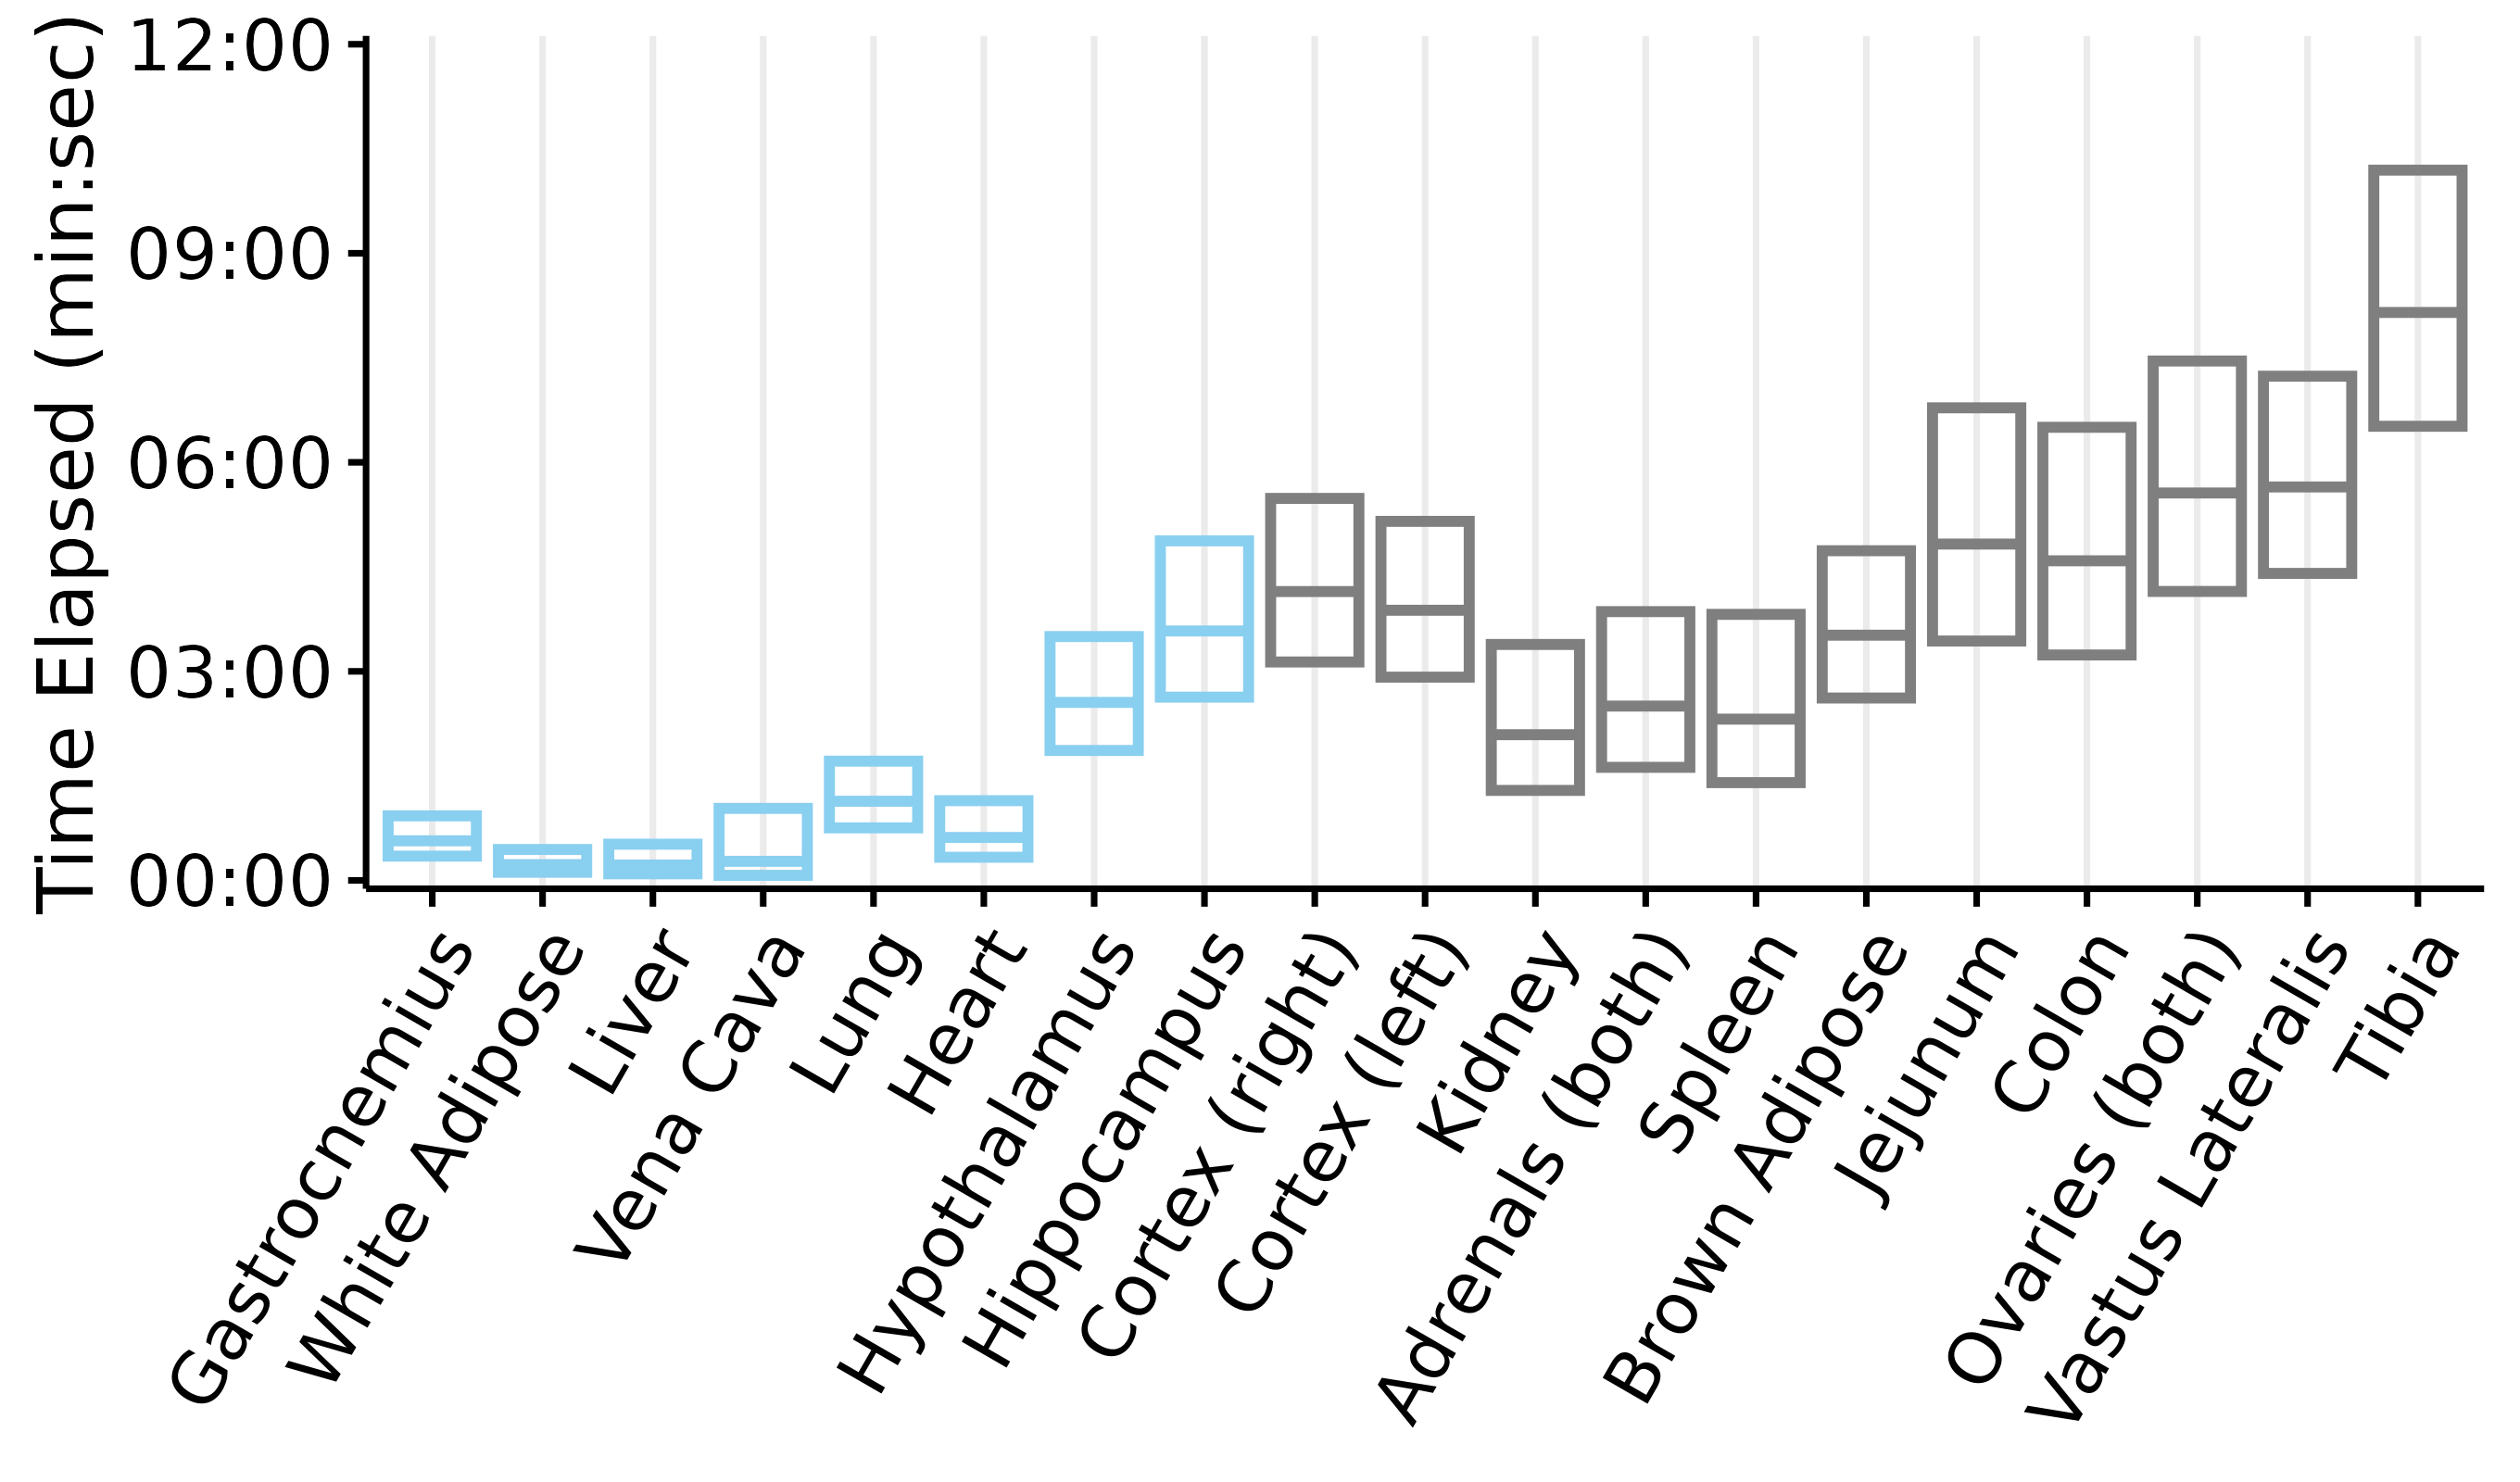

Session Info
sessionInfo()
#> R version 4.4.0 (2024-04-24)
#> Platform: x86_64-pc-linux-gnu
#> Running under: Ubuntu 22.04.4 LTS
#>
#> Matrix products: default
#> BLAS:   /usr/lib/x86_64-linux-gnu/openblas-pthread/libblas.so.3
#> LAPACK: /usr/lib/x86_64-linux-gnu/openblas-pthread/libopenblasp-r0.3.20.so;  LAPACK version 3.10.0
#>
#> locale:
#>  [1] LC_CTYPE=C.UTF-8       LC_NUMERIC=C           LC_TIME=C.UTF-8
#>  [4] LC_COLLATE=C.UTF-8     LC_MONETARY=C.UTF-8    LC_MESSAGES=C.UTF-8
#>  [7] LC_PAPER=C.UTF-8       LC_NAME=C              LC_ADDRESS=C
#> [10] LC_TELEPHONE=C         LC_MEASUREMENT=C.UTF-8 LC_IDENTIFICATION=C
#>
#> time zone: UTC
#> tzcode source: system (glibc)
#>
#> attached base packages:
#> [1] stats     graphics  grDevices utils     datasets  methods   base
#>
#> other attached packages:
#> [1] lubridate_1.9.3
#> [2] scales_1.3.0
#> [3] ggplot2_3.5.1
#> [4] tidyr_1.3.1
#> [5] purrr_1.0.2
#> [6] dplyr_1.1.4
#> [7] MotrpacRatTrainingPhysiologyData_2.0.0
#>
#> loaded via a namespace (and not attached):
#>  [1] gtable_0.3.5      beeswarm_0.4.0    xfun_0.43         bslib_0.7.0
#>  [5] htmlwidgets_1.6.4 rstatix_0.7.2     vctrs_0.6.5       tools_4.4.0
#>  [9] generics_0.1.3    tibble_3.2.1      fansi_1.0.6       highr_0.10
#> [13] cluster_2.1.6     pkgconfig_2.0.3   data.table_1.15.4 checkmate_2.3.1
#> [17] desc_1.4.3        lifecycle_1.0.4   farver_2.1.1      stringr_1.5.1
#> [21] compiler_4.4.0    textshaping_0.3.7 munsell_0.5.1     carData_3.0-5
#> [25] vipor_0.4.7       htmltools_0.5.8.1 sass_0.4.9        yaml_2.3.8
#> [29] htmlTable_2.4.2   Formula_1.2-5     pillar_1.9.0      pkgdown_2.0.9
#> [33] car_3.1-2         ggpubr_0.6.0      jquerylib_0.1.4   cachem_1.0.8
#> [37] Hmisc_5.1-2       rpart_4.1.23      abind_1.4-5       tidyselect_1.2.1
#> [41] digest_0.6.35     stringi_1.8.3     labeling_0.4.3    fastmap_1.1.1
#> [45] grid_4.4.0        colorspace_2.1-0  cli_3.6.2         magrittr_2.0.3
#> [49] base64enc_0.1-3   utf8_1.2.4        broom_1.0.5       foreign_0.8-86
#> [53] withr_3.0.0       backports_1.4.1   ggbeeswarm_0.7.2  timechange_0.3.0
#> [57] rmarkdown_2.26    nnet_7.3-19       gridExtra_2.3     ggsignif_0.6.4
#> [61] ragg_1.3.0        hms_1.1.3         memoise_2.0.1     evaluate_0.23
#> [65] knitr_1.46        rlang_1.1.3       glue_1.7.0        rstudioapi_0.16.0
#> [69] jsonlite_1.8.8    R6_2.5.1          systemfonts_1.0.6 fs_1.6.4